Irish Grid Monthly: July 2026
TL;DR
- Best month for solar (yet again), with the highest amount of electricity generated by solar farms in a single month (275GWh), highest share of electricity demand met by solar farms in a month (8.4%), and highest share of electricity demand being met by solar farms at a single point in time (33.4% on July 19 at 3:15pm).
- Meanwhile, approximately 20% of available wind and solar farm power was dispatched down. This was roughly double the rate of July 2025, when 9.4% of available wind and solar were dispatched down. More details on wind and solar dispatch down later in this newsletter issue.
- How much of the island's electricity demand was met by each fuel source in July 2026:
- 32.2% renewables: 23.2% wind, 8.4% solar, 0.2% hydro, 0.4% biomass
- 46.5% fossil fuels: 6% gas, 0.1% oil, 0.3% waste
- 1.4% storage: 0.9% pumped storage, 0.5% batteries
- 19.8% net imports
- Galway reached #1 in the county-level renewable energy rankings. Despite a lot of dispatch down for wind, having both wind and solar (the newly online Ballymoneen consistently peaking at 100MW last month and being unaffected by dispatch down) helped Galway top the charts in July.
July data releases: data centres and emissions
There were quite a few key 2025 data releases in July regarding electricity demand and emissions: Ireland’s greenhouse gas emissions data by sector from the EPA, SEAI’s note on Ireland’s energy supply and security of supply, and quarterly data centre electricity consumption and hourly large energy user (LEU) electricity consumption from the CSO.
We at Green Collective provide real-time estimates of emissions from electricity generation, and data updates from the EPA in July are one of the only opportunities for us to calibrate our work. Both the EPA and SEAI released annual emissions data for 2025 last month and the comparisons are below.
- EPA: 6.6Mt in 2025, a 7.1% decrease from 2024
- SEAI: 6.4Mt in 2025, an 8.4% decrease from 2024
- Green Collective: 6.8Mt in 2025, a 7.4% decrease from 2024
These numbers make us feel confident about our real-time estimates, particularly when looking at the alignment with the EPA. If anyone has insights into why there are slight differences between EPA and SEAI data, please let us know. The decrease in emissions between 2024 and 2025 is due to two major factors: Ireland ceased to burn coal in June 2025 and imports have increased with the addition of Greenlink Interconnector.
However, what got more coverage last month was the new data on electricity consumption of data centres and/or large energy users (LEU). Based on new releases from the CSO, data centres consumed 23% of metered electricity in 2025. We did a deep dive into CSO’s 2024 data centres and LEU demand methodology (the two categories have overlaps but are not entirely interchangeable) in our February issue.
Looking at the newly available 2025 CSO data, many points from our previous analysis still stand, such as the lack of flexibility in LEU demand. The chart below compares average hourly demand by large energy users and estimated grid carbon intensity throughout the week in 2024 and 2025.
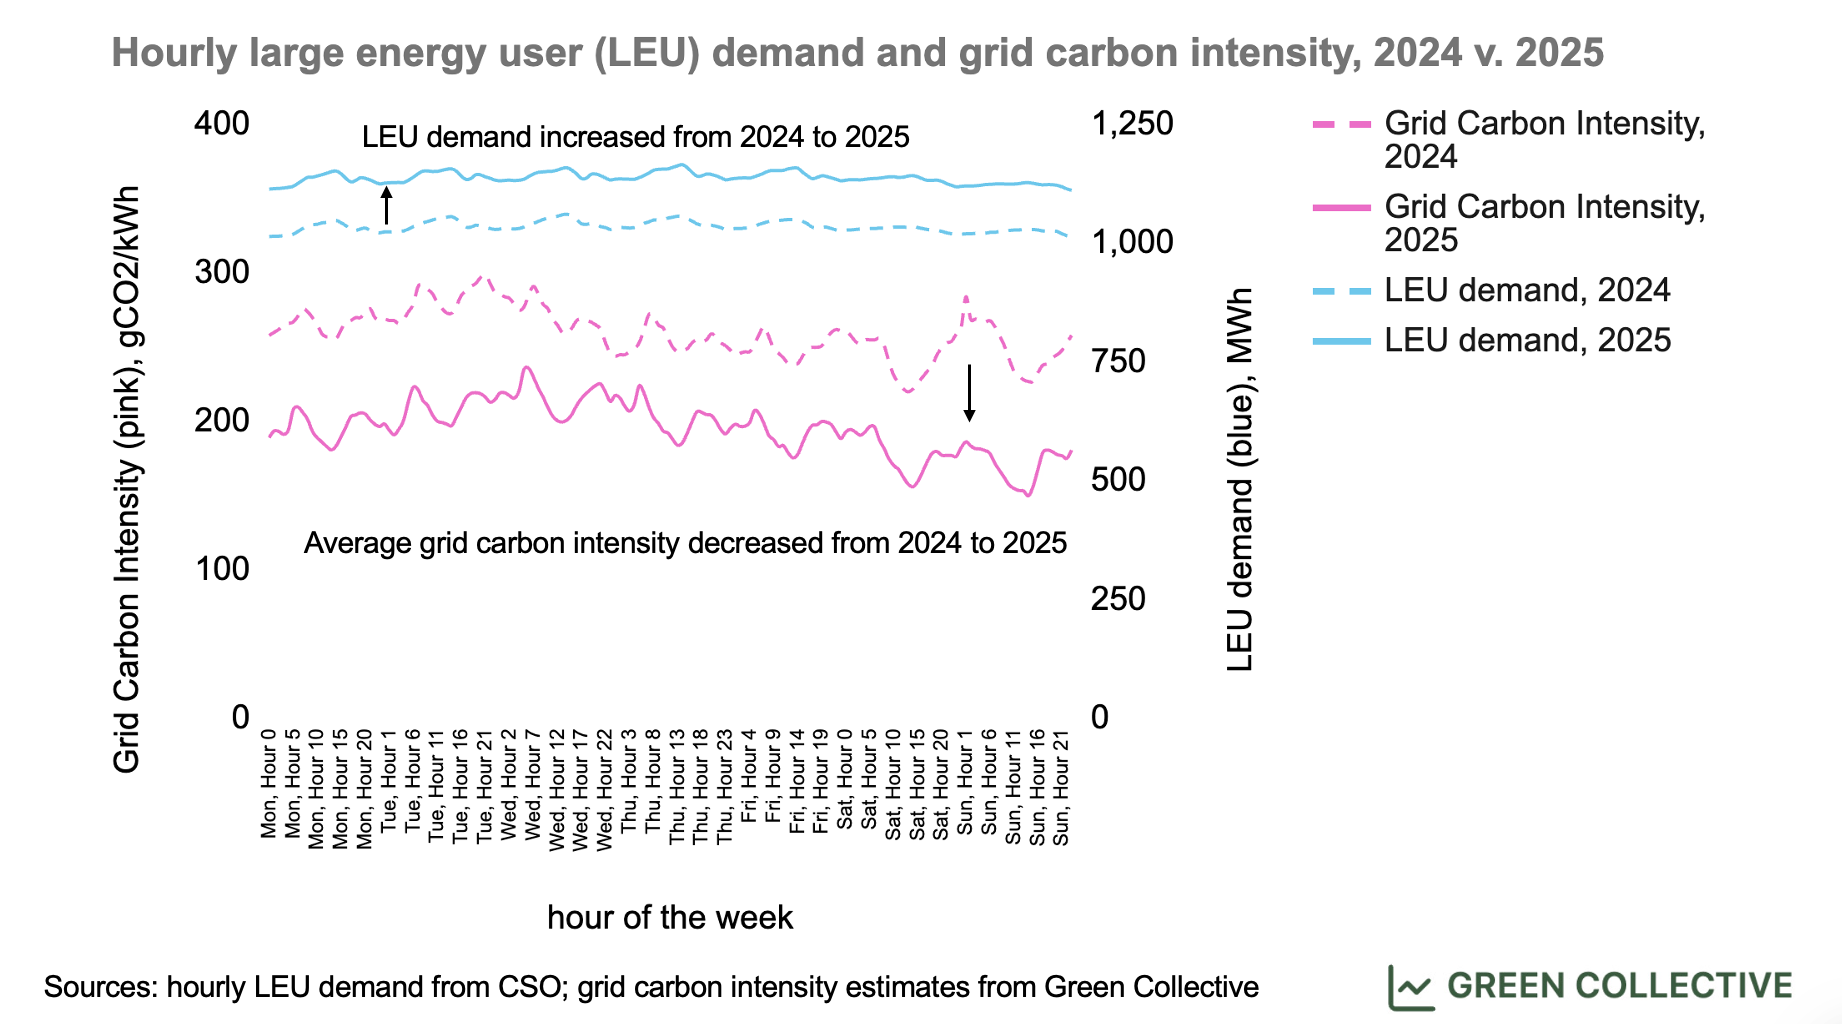
In addition to overall reductions in grid carbon intensity, we also see sharper decreases during the day thanks to more solar generation. Meanwhile, hourly demand data of large energy users are still more or less flat, exhibiting the same trends in 2024 and 2025. As data centre demand continues to be a hot button issue, while it’s important to examine how such demand is met (grid connections, gas network connections, backup fossil fuel generators, private wires, etc), it’s also crucial to explore demand flexibility potential to reduce emissions associated with this behemoth of a sector.
Records
As in June, July saw incremental improvement in solar and battery output:
- Highest total output from solar farms of 275GWh.
- That 275GWh was equal to 8.4% of the island's electricity demand, the highest monthly share for solar farms yet.
- On Sunday, July 19, solar farm output peaked at 33.4% of electricity demand; a new high on the Irish grid.
- On Sunday, July 26, discharge from battery plants peaked at 8.6% of electricity demand, a new high on the island.
Since this is the third month in a row each of these solar metrics have reached new highs, here's a table to help to show the steady growth:
| Metric | May 2026 | June 2026 | July 2026 |
|---|---|---|---|
| Solar output (GWh) | 234 | 235 | 274 |
| % of demand met by solar | 6.98% | 7.30% | 8.35% |
| Peak % of demand from solar | 32.26% | 32.71% | 33.38% |
Again, you can follow all of these figures and many more in real-time on our records dashboard.
Emissions
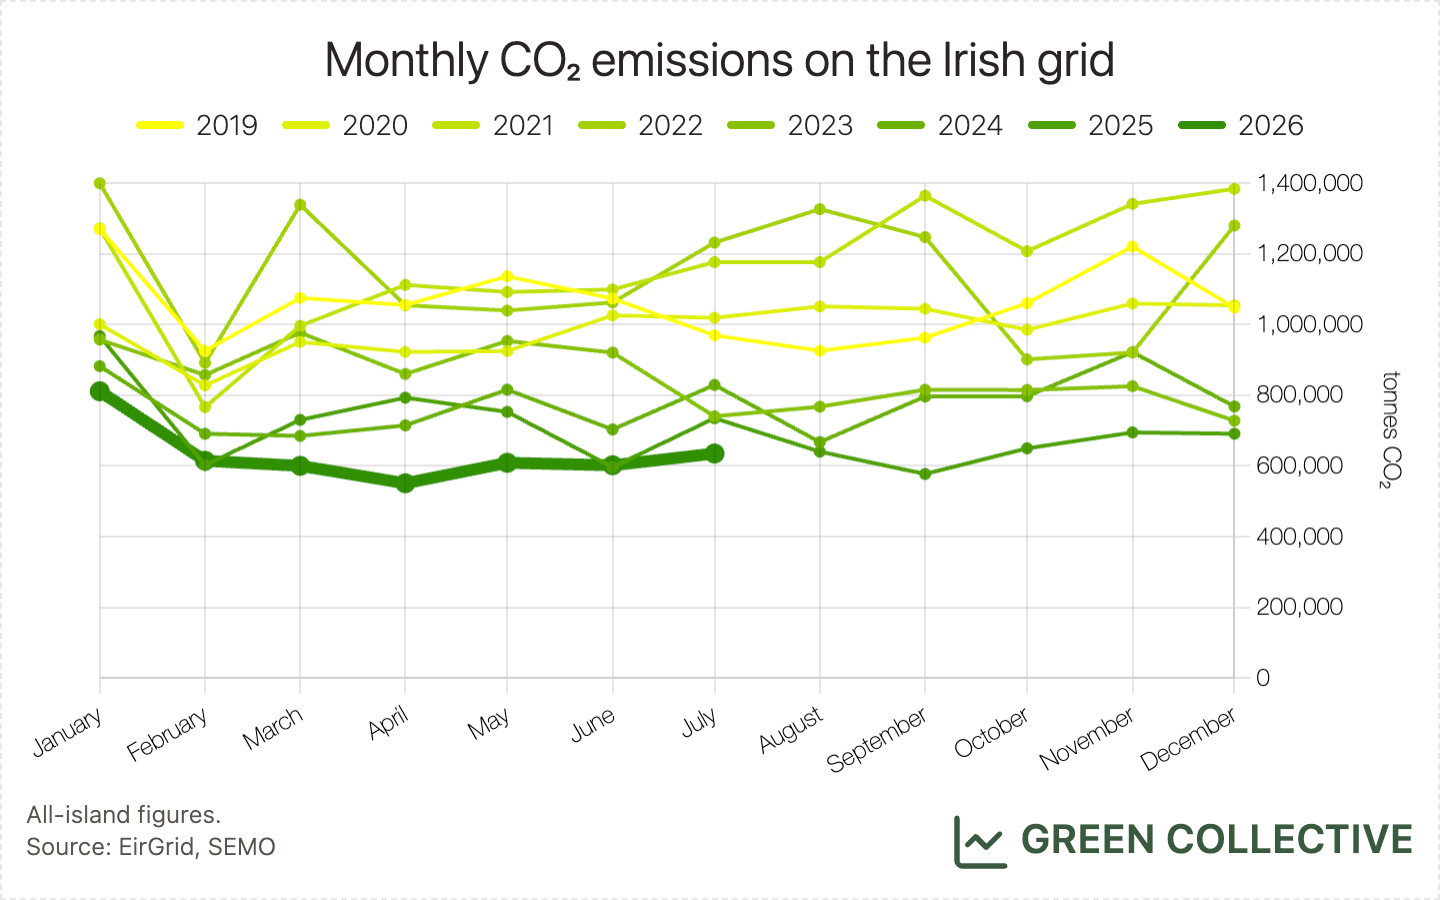
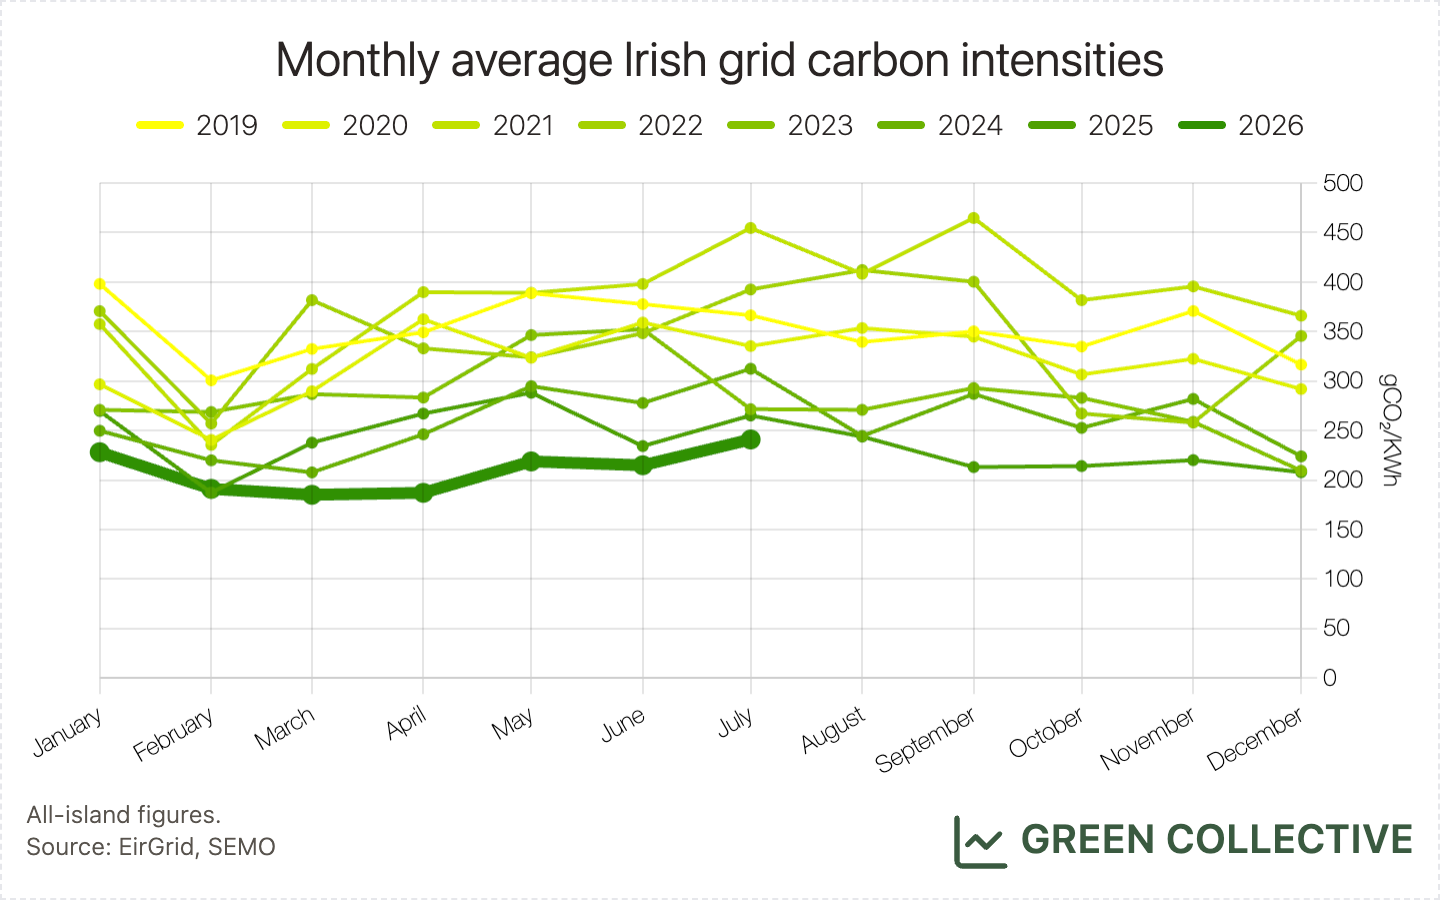
In July 2026 the Irish grid emitted approximately 635,000 tonnes of CO₂ ranging, for each kWh of electricity generated, between 121g and 422g of CO₂ for an average grid carbon intensity (GCI) of 241gCO₂/KWh.
Both tonnage and GCI figures are the lowest yet for a July month, beating July 2025's 735,000 tonnes/265gCO₂/KWh. A reduction of 100,000t of CO₂ is a 14% year-on-year decrease in emissions – impressive, and the chart below shows that July CO₂ emissions were well over 1,000,000 tonnes as recently as 2022!
County-level analysis
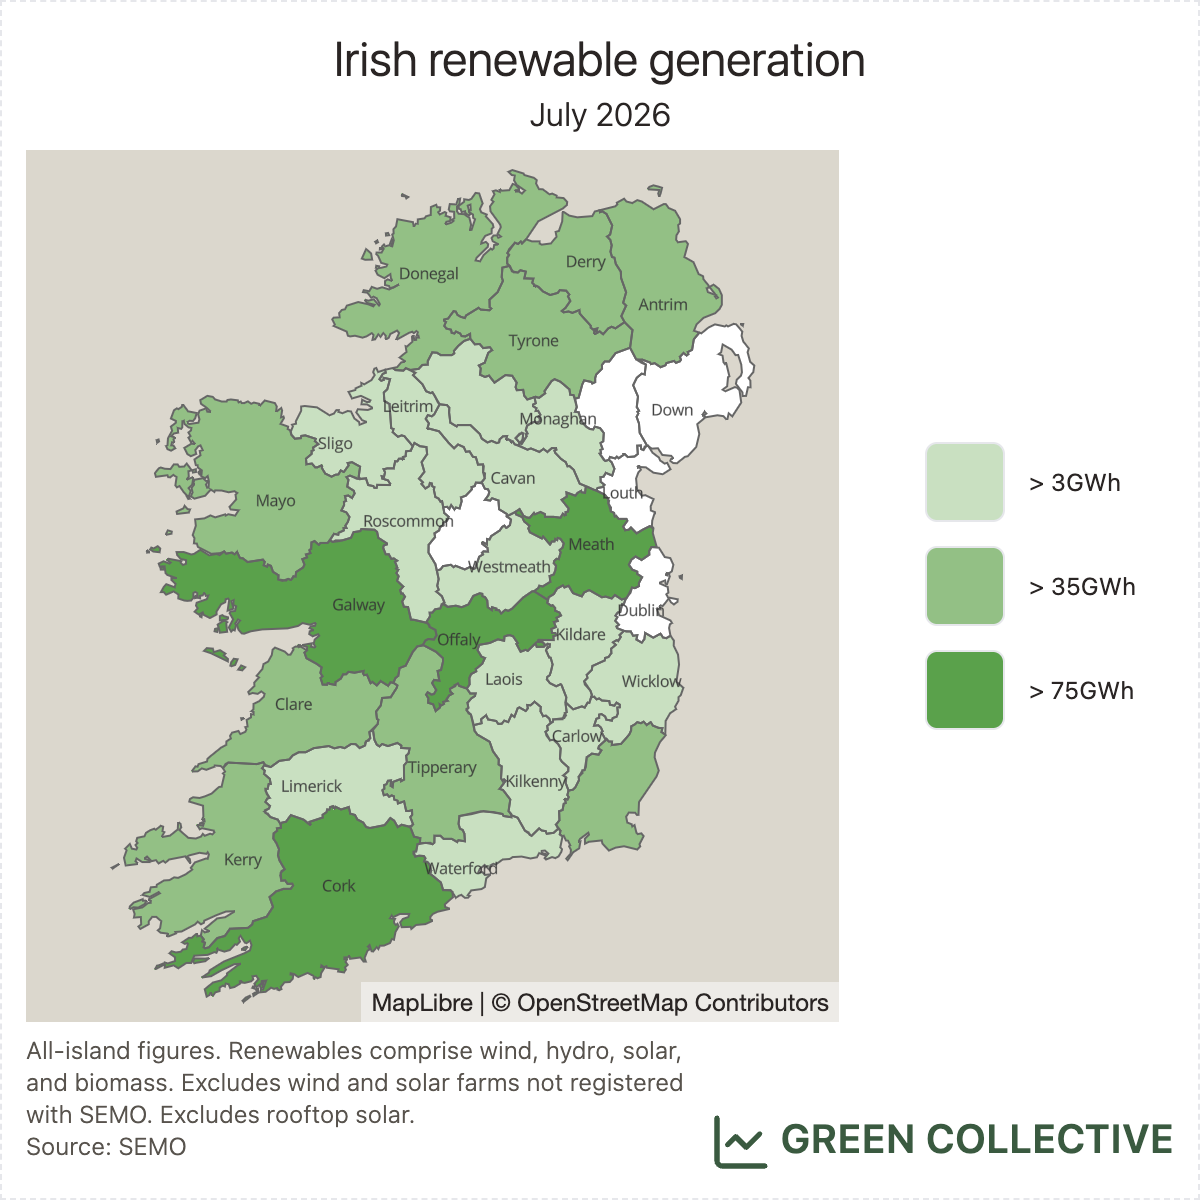
The top five renewable-producing counties in July 2026:
- Galway
- Meath
- Cork
- Offaly
- Kerry
Re-read that list! For the first time, Galway produced the most renewable energy in a single calendar month; Meath reached its highest ever position; and Cork and Kerry are both out of the #1 and #2 spots. Winds were low and Offaly's biomass plant was offline during July; but, really, this is the solar-led shake-up to the monthly rankings we've been waiting for – keep reading to find out exactly what happened.
Thank you for reading! The rest of the newsletter is available to paying subscribers only. We go into more details on our dispatch down estimates and point you to specific unit-level data that explains the trends we saw in July. You can upgrade to a paid subscription to access all our analysis.