Irish Grid Monthly: June 2026
We'll long remember June 2026 for the prolonged, record-breaking heatwave in mainland Europe. As some of you know, we're based in Zürich, Switzerland, which experienced daily highs of 35C for well over a week: an unprecedented stretch here, with the dreaded "tropical nights" of 20C+ providing no relief. Between this and caring for our newborn, please excuse us once again if we've missed anything this month – or if we focused too much on solar and carbon emissons!
TL;DR
- Best month for solar, with the highest amount of power generated by solar farms, highest share of electricity demand met by solar farms, and highest share of electricity demand being met by solar farms at a single point in time.
- Best June for wind, with the highest amount of power generated by wind farms and joint-highest share of electricity demand met by wind farms.
- Some solar farms are losing up to 25% due to transmission constraints in June. Full details in the premium member section, below.
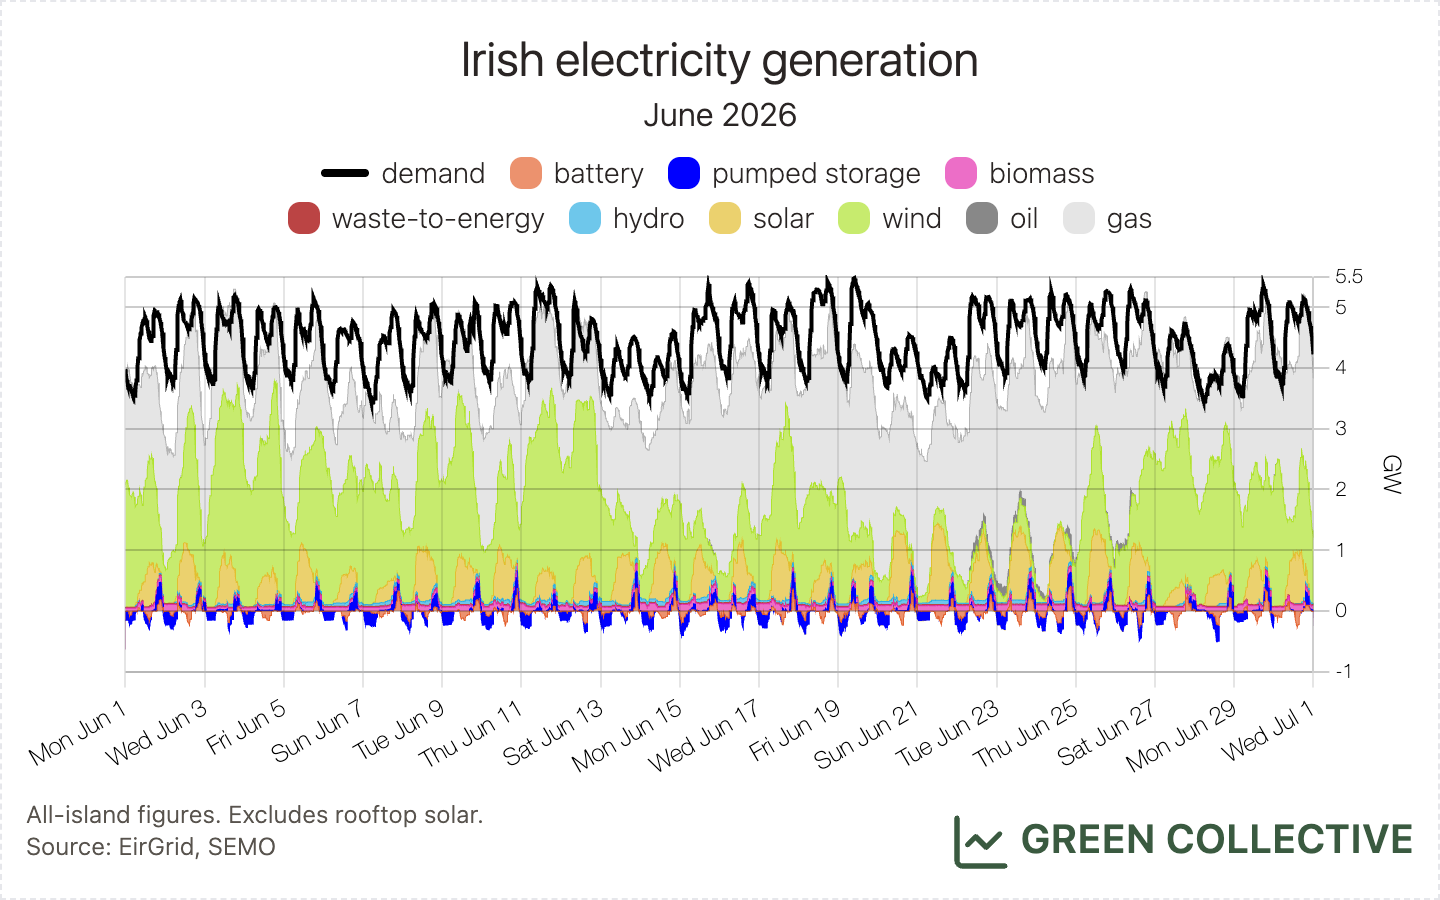
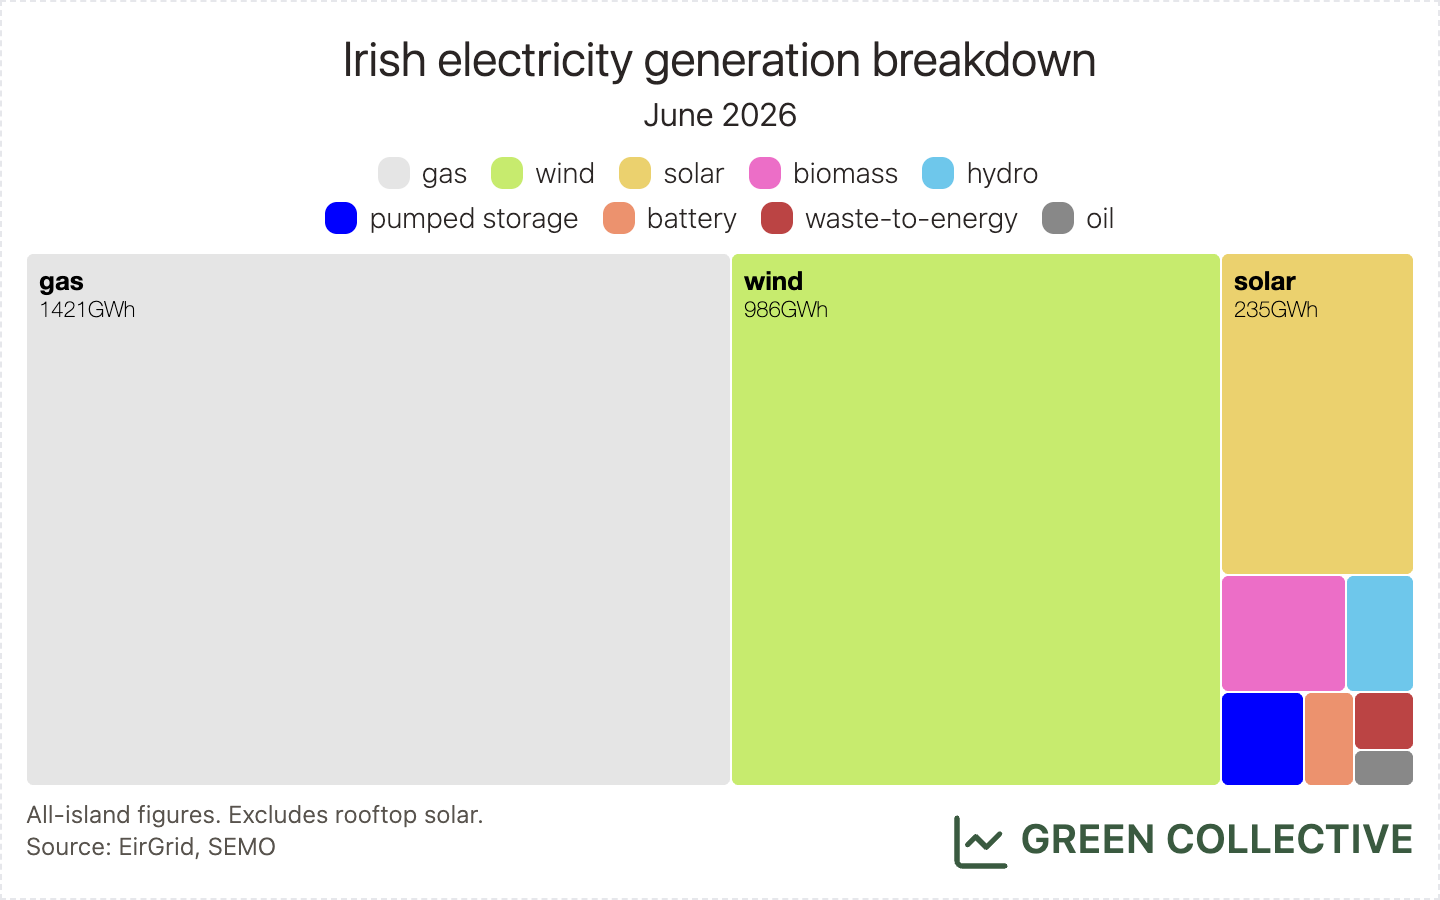
- How much of the island's electricity demand was met by each fuel source:
- 40.6% renewables: 30.7% wind, 7.3% solar, 0.9% hydro, 1.7% biomass
- 44.9% fossil fuels: 44.2% gas, 0.2% oil, 1.5% waste
- 13% net imports
- 1.5% storage: 0.9% pumped storage, 0.6% batteries
Records
It was asking a lot to even come close to last month's slew of solar records. However, we did still see incremental improvement in solar and one important new high in storage:
- Solar met 7.3% of the month's electricity demand.
- On June 21, solar output at 2.15pm reached 32.8% of the island's electricity demand. Additionally, solar farms met just over 13% of the island's electricity demand on this day.
- On June 13, battery output reached 8.5% of the island's electricity demand.
Something all three records have in common is they're demand-related. In Ireland, demand is lowest during summer – additionally, the two output records both occurred over the weekend when demand is even lower than from Monday-Friday. That said, demand has been steadily increasing, too: in June 2026, demand was up, year-on-year, roughly 2% from June 2025.
As always, you can follow records in real-time on our dashboard.
Emissions
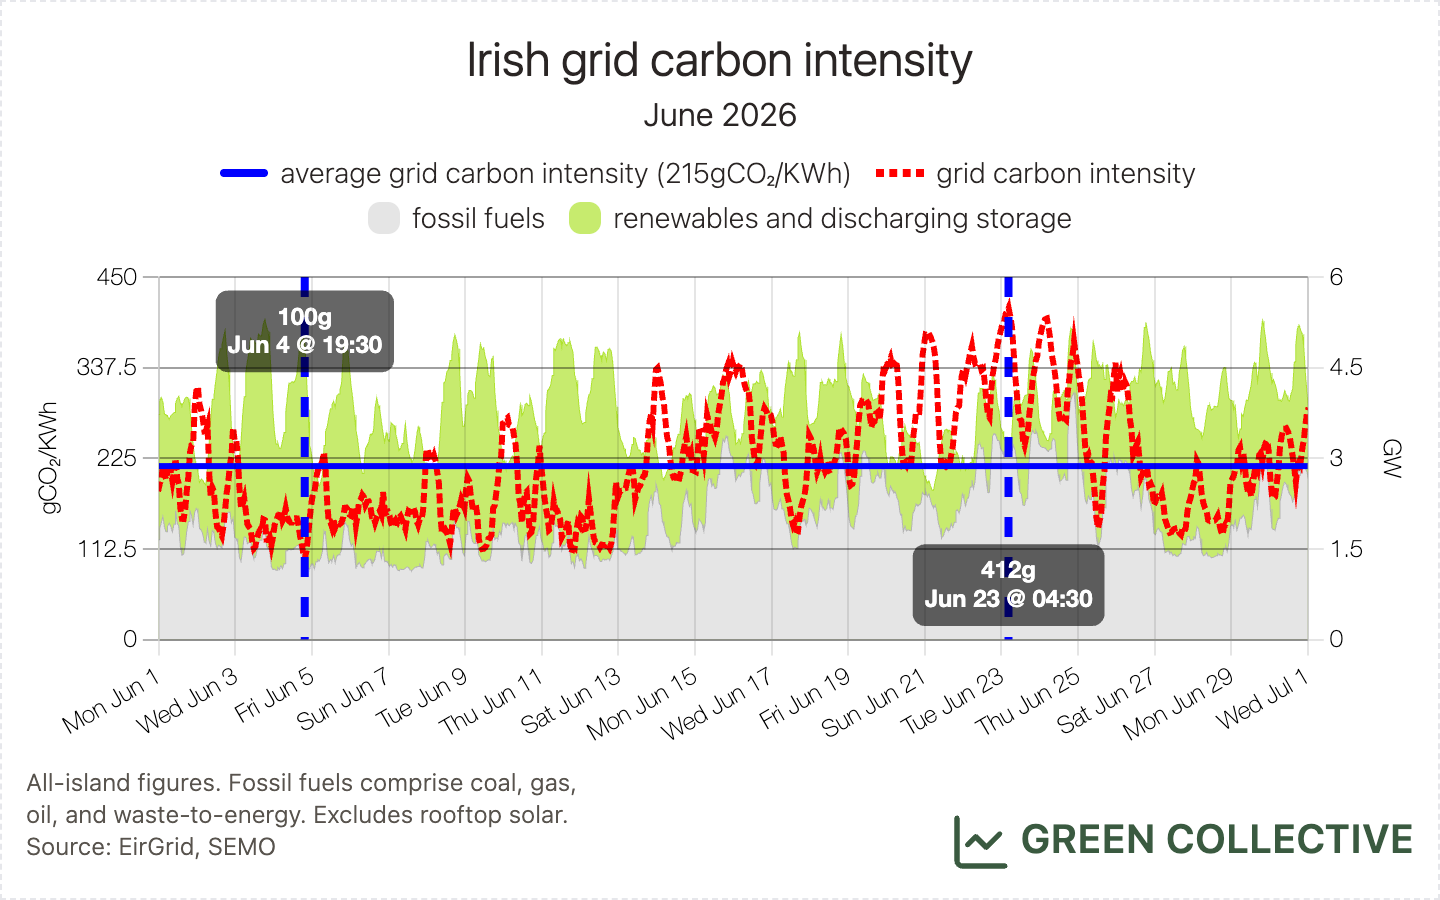
In June 2026 the Irish grid emitted approximately 605,000 tonnes of CO₂, ranging, for each kWh of electricity generated, between 100g and 412g of CO₂ for an average grid carbon intensity of 215gCO₂/KWh.
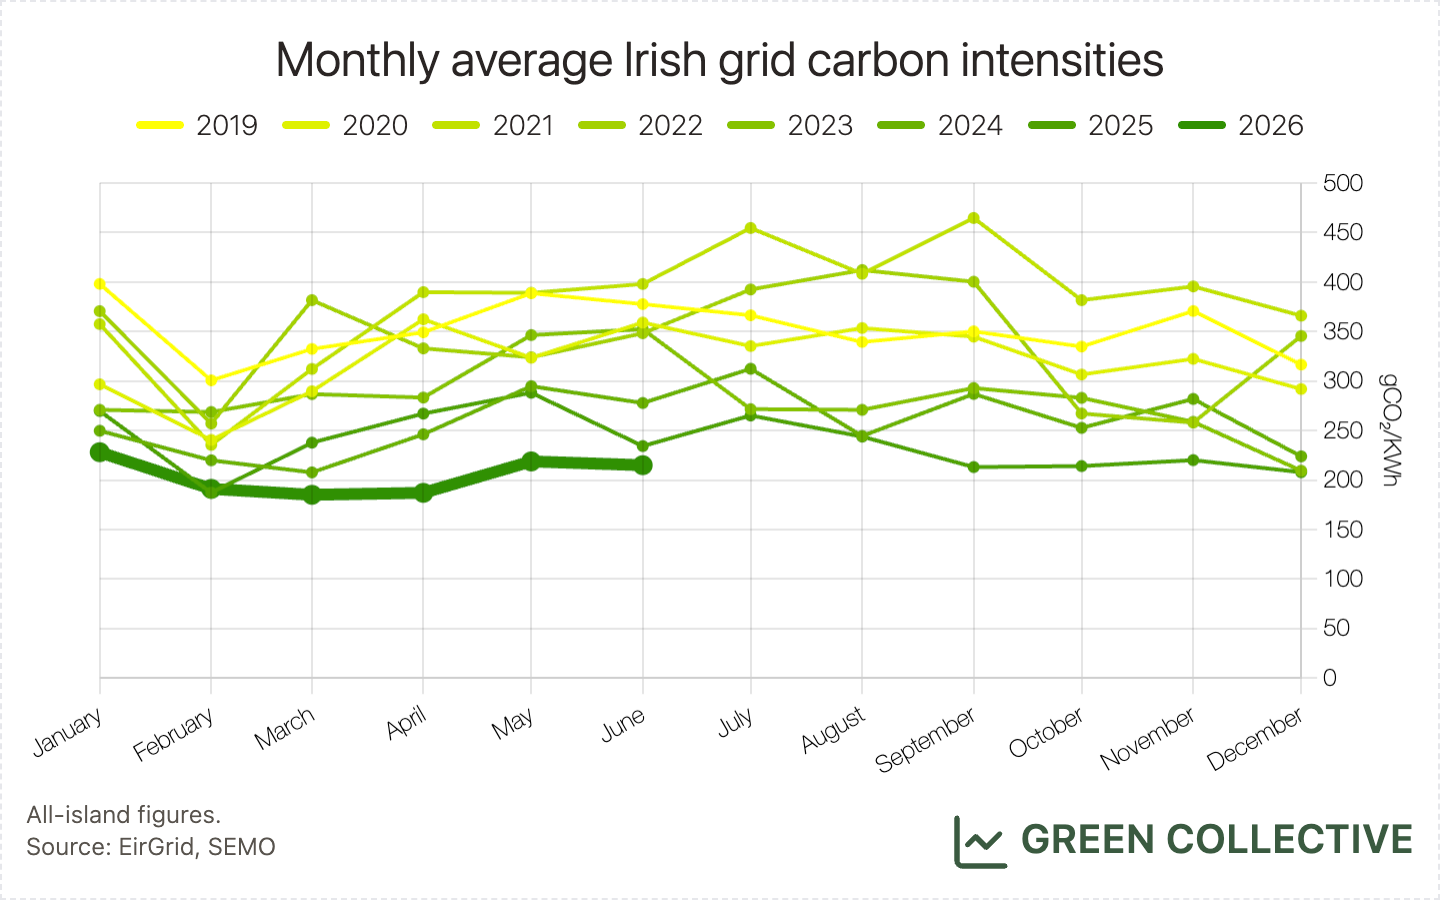
That's a much higher figure than we were seeing earlier this year but we expect grid carbon intensity to be highest in summer: while solar has been increasing rapidly, it's still not nearly large enough yet to bridge the gap between summer and winter winds. That said, June's figure is down significantly year-on-year from June 2025's 234gCO₂/KWh and, for the second month in a row, sets a new low for average grid carbon intensity low in any summer month (May-August). As the chart below shows, summer grid carbon intensity has approximately halved over the past several years.
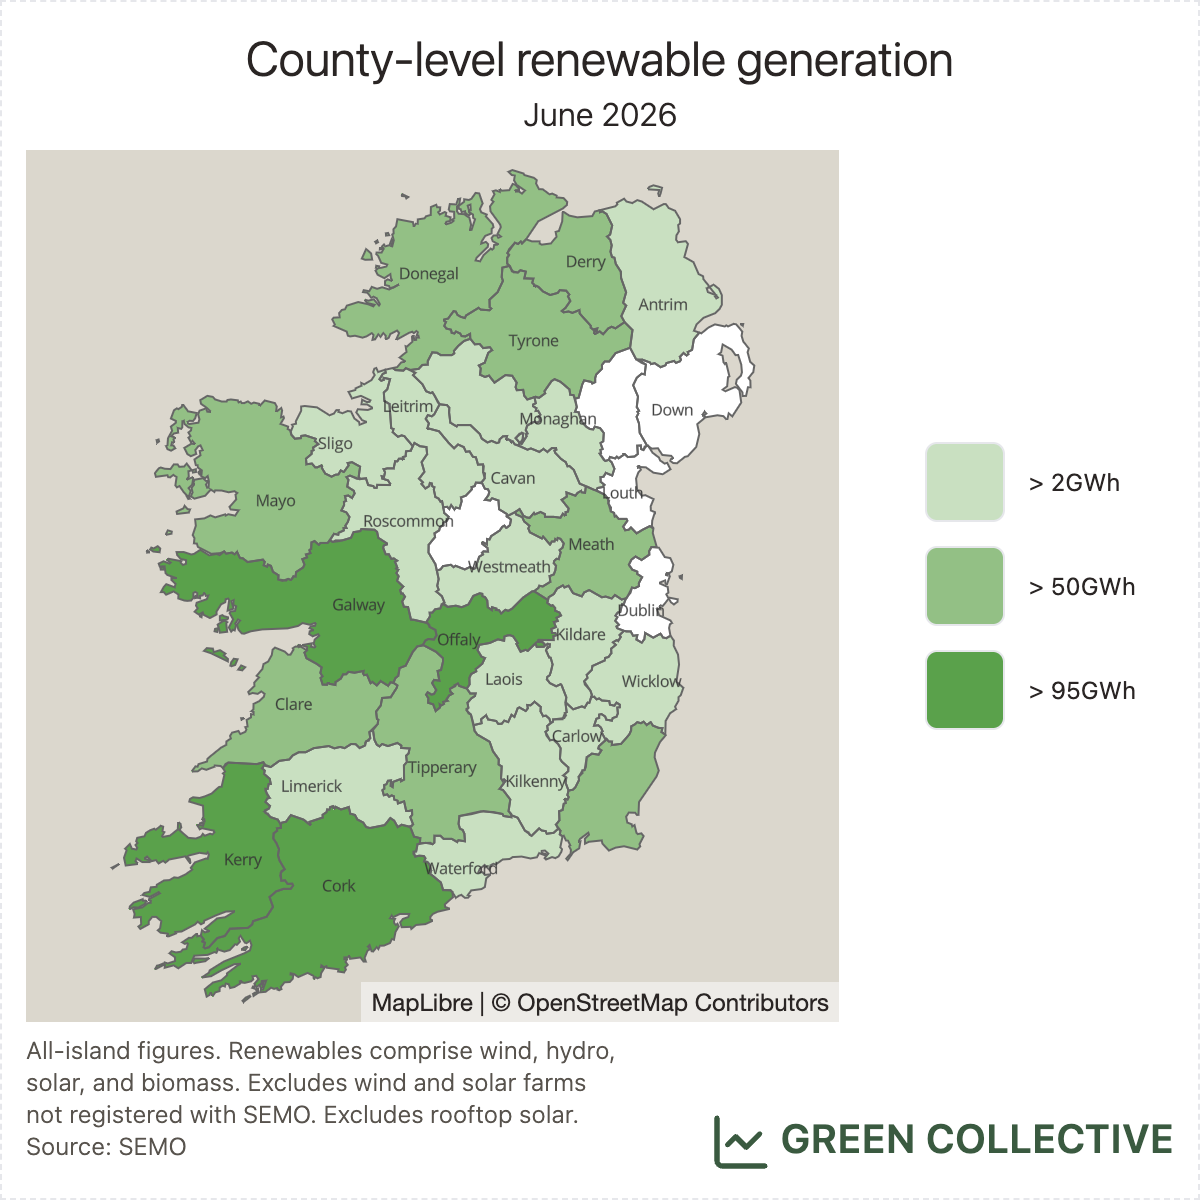
County-level analysis
The top five renewable-producing counties in June 2026:
- Offaly
- Cork
- Kerry
- Galway
- Tipperary
The top three positions haven't changed much in recent months: while Kerry has most wind, Cork also has solar; Offaly has a biomass plant which is immune to the changing seasons and so can comfortably out-generate both counties in the summer. Most notable this month is Meath by its absence: despite being the clear leader in Irish solar, Tipperary just beat it to #5 – some indication of how strong winds were for a June month.
Thank you for reading! The rest of the newsletter is available to paying subscribers. We go into more details on our dispatch down estimates and cover more highlights for wind, solar, storage, and fossil fuels respectively. You can upgrade to a paid subscription to access all our analysis.