Irish Grid Monthly Plus: February 2026
Introduction: more data transparency in large energy users demand
Electricity demand on the island of Ireland during February 2026 totalled 3628.2GWh. This was the highest electricity demand ever seen in a February month, representing a 3.9% year-on-year increase from February 2025. The days are still pretty cold, and demand remains high.
Speaking of demand, the Central Statistics Office (CSO) published hourly electricity consumption data of large energy users for the first time at the end of January. We always welcome more data transparency and here are four key takeaways after examining the hourly dataset for 2023 and 2024, in comparison with previously released datasets, such as quarterly electricity consumption by data centres and county-level demand.
- While we tend to use large energy users (LEU) and data centres interchangeably when discussing electricity consumption, the new hourly dataset clarifies that 76% of LEU demand comes from data centres in the Republic of Ireland (ROI).
The chart below shows metered electricity consumption from data centres and other large energy users in 2023 and 2024. While total electricity consumption grew by just over 4% in ROI from 2023 to 2024, the LEU segment increased by 9.4% and the data centre sub-category by 10%.
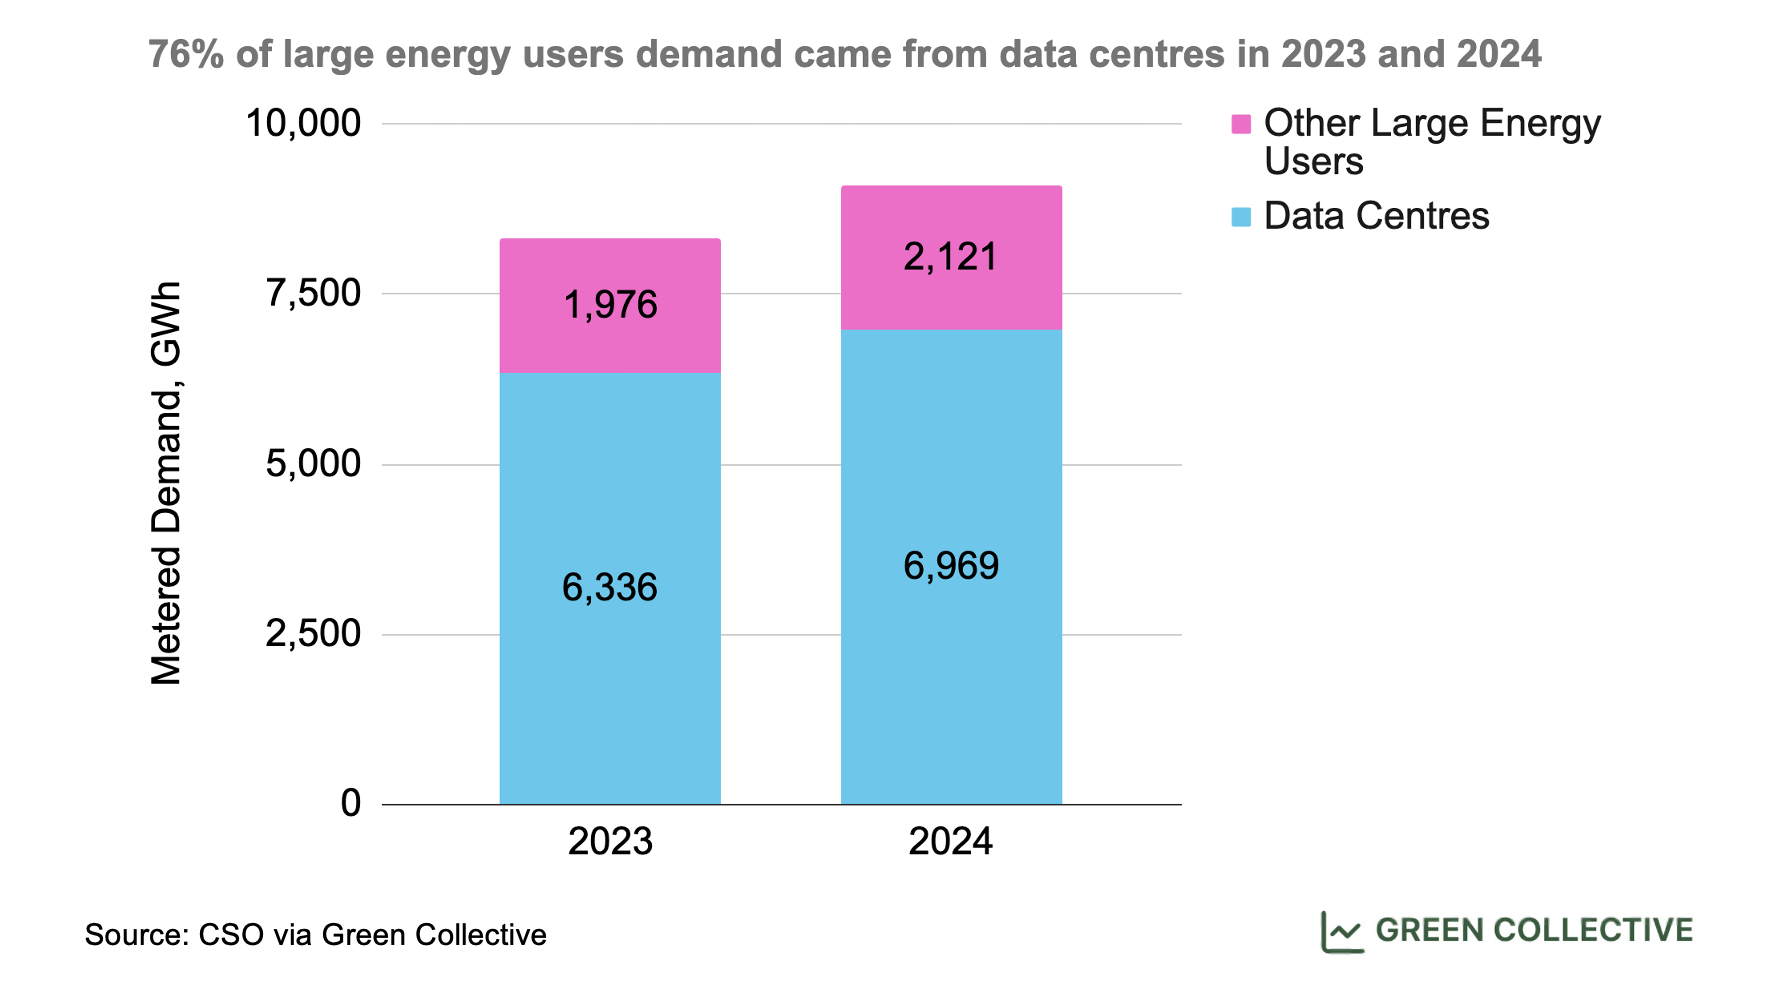
In 2024, 22% of ROI's metered electricity consumption was from data centres, a frequently cited data point demonstrating the sector's seemingly insatiable demand. It's worth noting that calculating data centre load is no mean feat, as meter data does not readily identify data centres. The CSO uses four main methods to separate data centres from other types of load. We return to their methodology often (see "Coverage" on this CSO page) and appreciate the care and thoughtfulness in estimating this secretive sector.
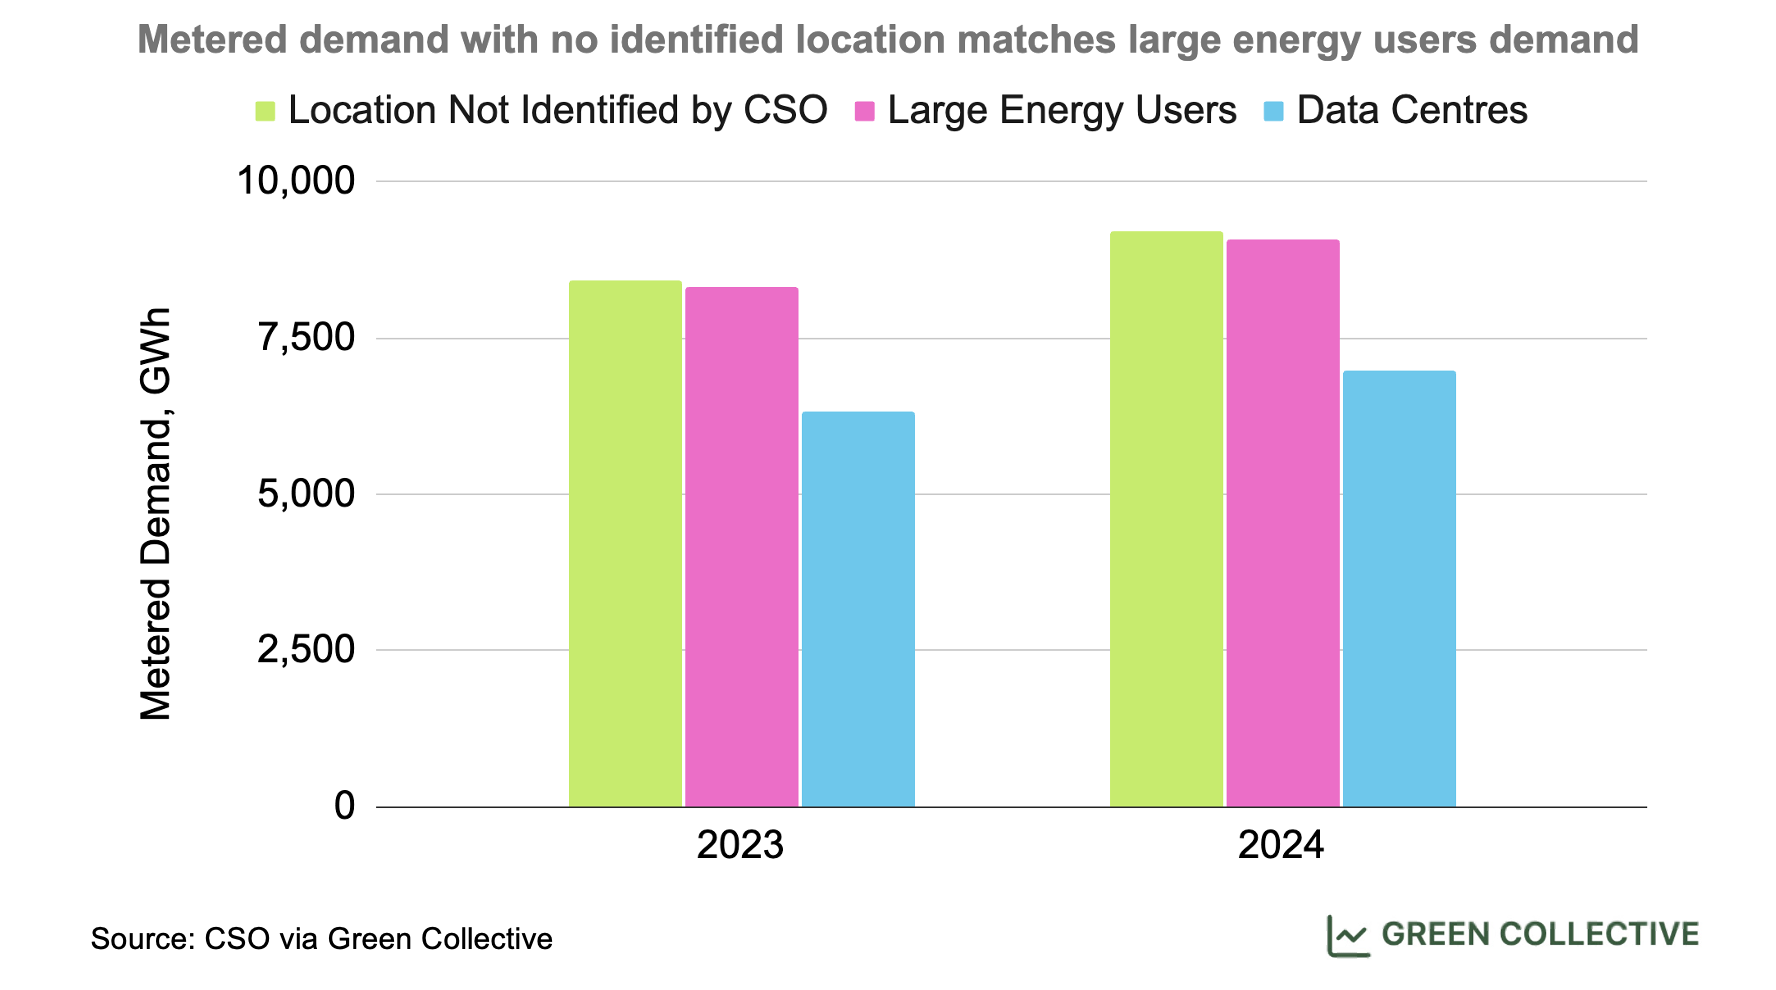
- In addition to the difficulty in identifying metered data centre electricity consumption, it's also challenging to identify the location of large energy users. The amount of electricity consumption the CSO is unable to assign location is almost identical to that of LEUs.
According to the CSO, they were not able to assign a county to a meter in some cases. Additionally, some large energy users do not have county information due to confidentiality reasons. When we compare annual demand from LEUs based on the new hourly dataset and metered electricity consumption without geographic information, they track closely and are within 2% of each other.
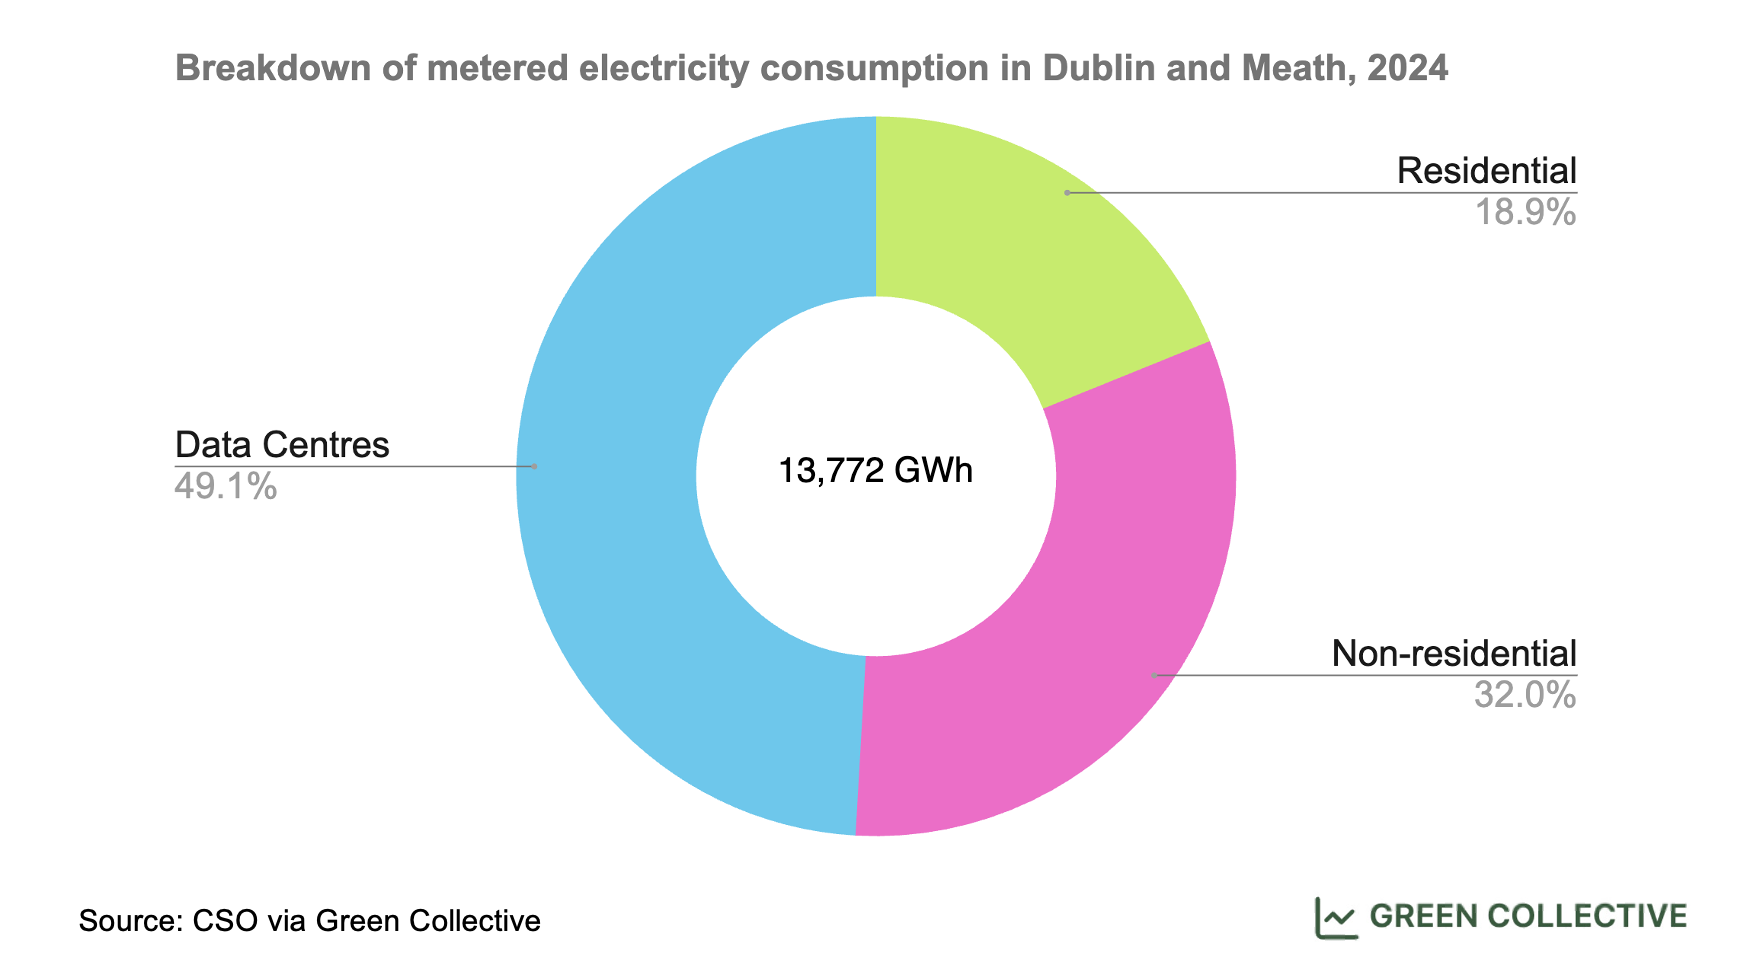
- The lack of transparency in large energy users' locations also poses challenges when one tries to accurately estimate the share of the sector's electricity demand in areas with high data centre density, namely Dublin/Meath. In 2024, at least 49.1% of metered electricity was consumed by data centres in Dublin/Meath.
Since large energy users' demand and metered consumption without identifiable location look almost identical on an annual basis, it makes sense to assume geographically-specific data for Dublin and Meath published by the CSO does not cover data centres. In fact, this is the same approach used by the CRU in the Large Energy Users Connection Policy released in December.
While the newly available hourly data on LEU demand is certainly a welcome progress, the lack of transparency in location continues to be challenging.
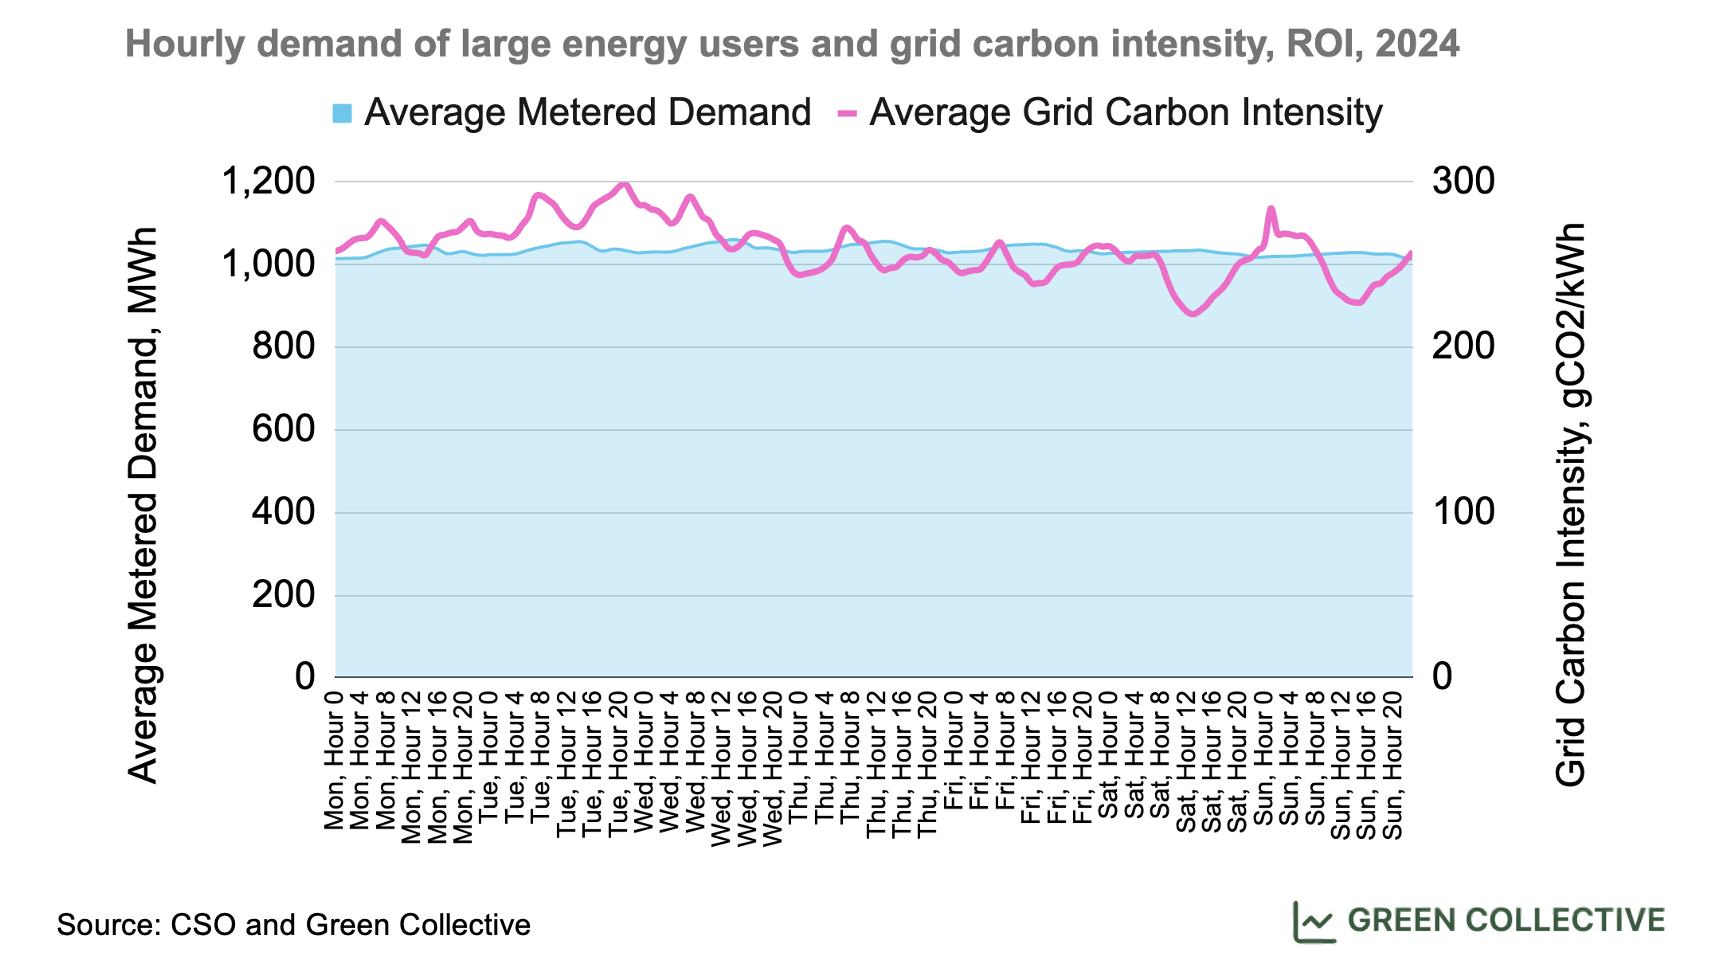
- Ideally, data centres should be able to reduce emissions if their demand could respond to grid carbon intensity. However, the newly available hourly dataset shows demand from LEUs/data centres is the opposite of flexible, at least for now, as metered electricity consumption remains extremely flat throughout the year.
The chart below displays average metered electricity consumption of large energy users on an hourly basis for each day of the week in 2024. We first heard about this new dataset via this post from Lee Carroll at the SEAI. As he pointed out, there is little variance in hourly demand. We added Green Collective's grid carbon intensity estimates on the chart below. While average grid carbon intensity doesn't vary greatly either, it fluctuates a lot more than large energy users demand.
Data centre demand flexibility has been a hot topic over the last year, if not longer, but it's unclear whether the demand concentrated in Dublin/Meath actually has the potential to be flexible. For example, batch processes such as training AI models are far more amenable to pre-emption and/or re-scheduling than time-sensitive operations such as serving a dynamic website. While we suspect the former is likely comprise more of the total load in recent years, any estimate of the percentage of load that is easily re-schedule would be pure hand-waving. If you have any insights into this and would like to share with us, please send us a note at hello@greencollective.io.
High-level stats
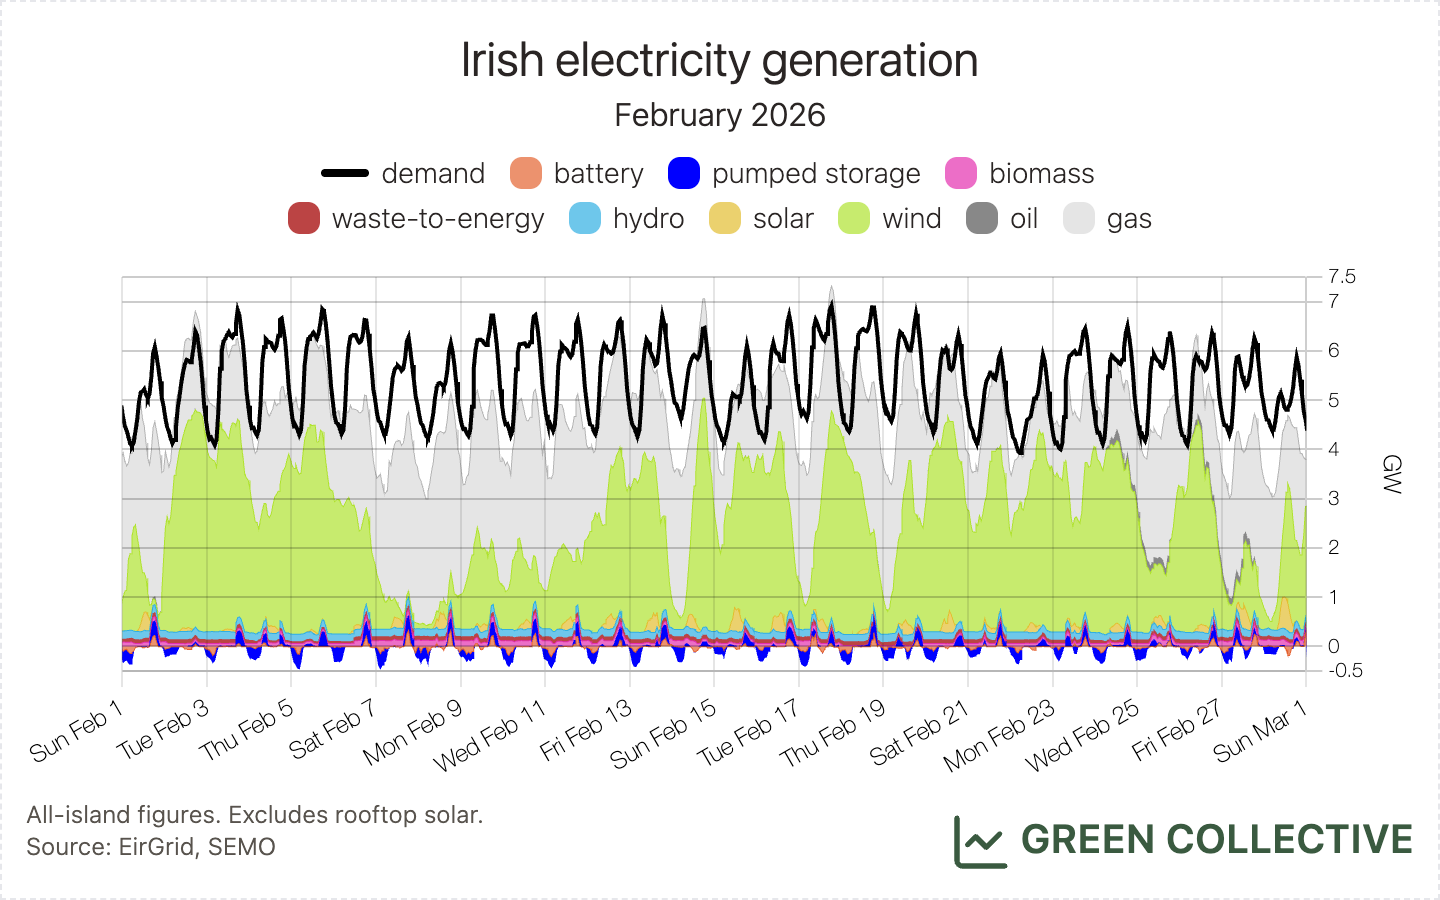
This is how all-island electricity demand was met in February 2026:
- Renewable generation equalled 47.6% of demand.
- Fossil fuel generation equalled 39.9% of demand.
- Pumped storage and discharging batteries equalled 1% of demand.
- Net imports equalled 11.5% of demand.
Renewable generation
Renewable generation during February 2026 totalled 1726.9GWh, equivalent to 47.6% of the island's electricity demand.
As has now been the case each February month since 2020 – with the exception of February 2023 – there was more renewable generation during February than fossil fuel generation. This has also happened during a handful of other winter months since 2023, most recently in December.
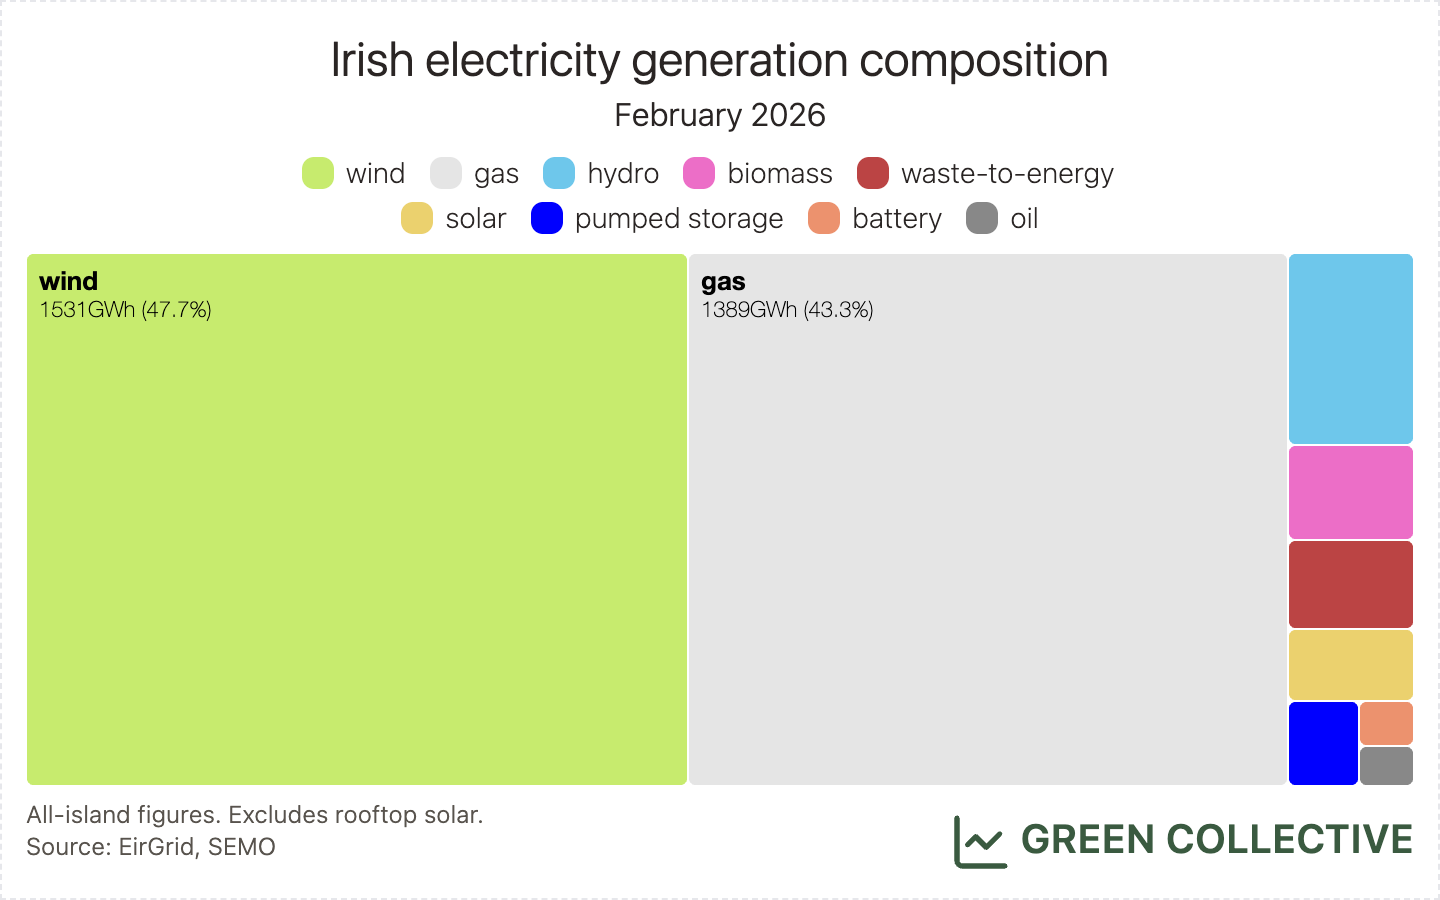
A full breakdown of renewable generation:
- biomass: 52.1GWh / 1.4% of demand
- hydro: 104.6GWh / 2.9% of demand
- wind: 1531.1GWh / 42.2% of demand
- solar: 39.2GWh / 1.1% of demand
Wind
Wind was the largest source of electricity this month, as has now been the case every February since 2020 with the exception of February 2023. Although the bumper years of 2020-2022 increasingly look like an exception, there remains an upward trend and we think it's fair to keep calling February the best month for wind.
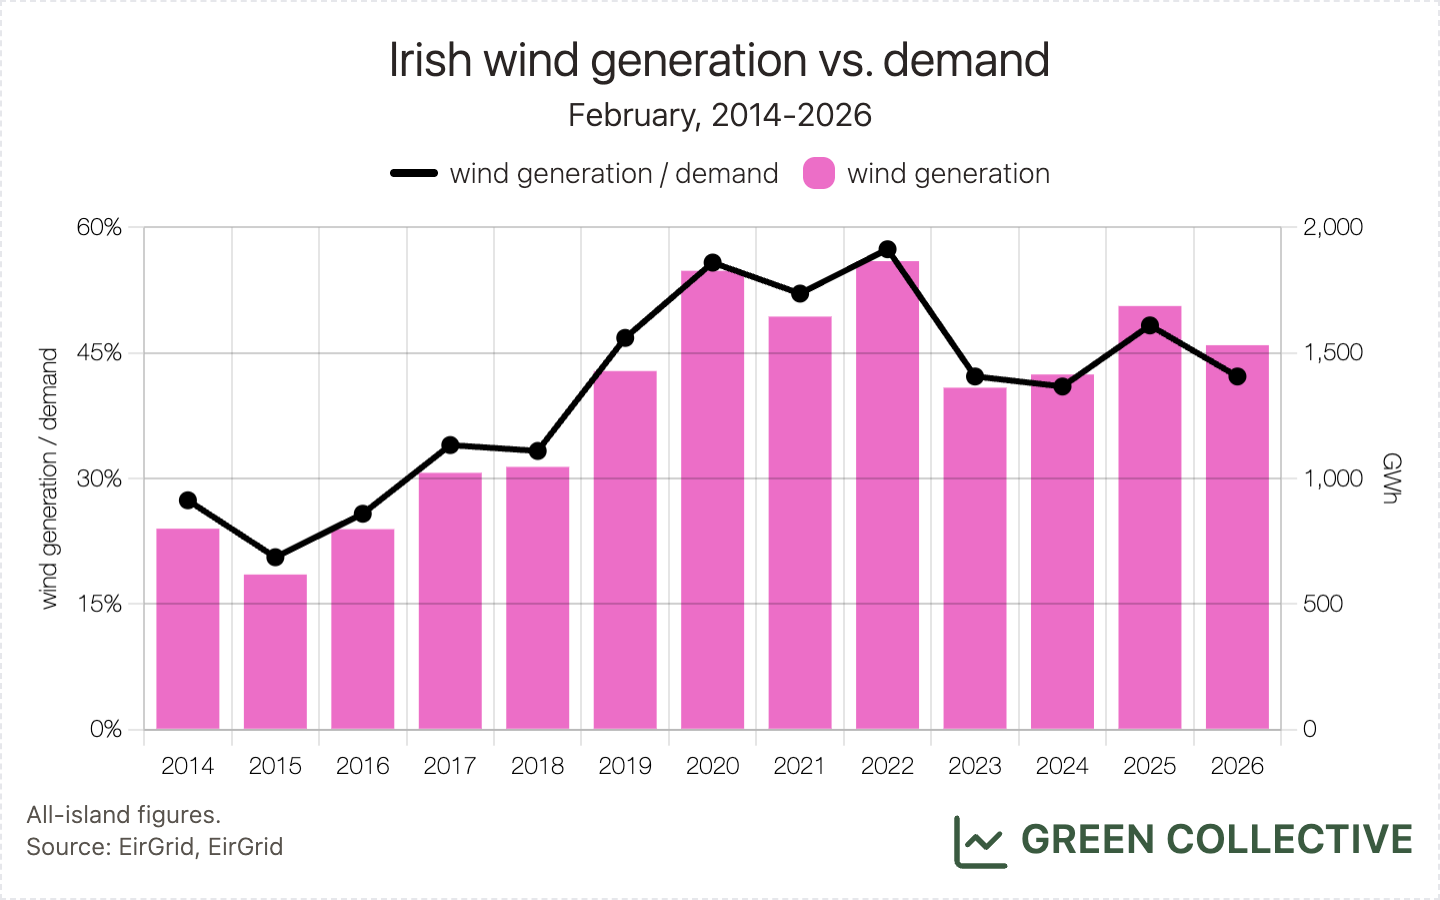
Early in the evening of Saturday, February 14, the island recorded a new all-time record for wind output: 4686MW, equivalent to 72% of electricity demand at the time. After a wait of almost exactly two years, this is the third time this wind record has been broken so far this winter. While new records are welcome, their magnitude (as we noted in December) is growing much slower than wind capacity: this latest record is just 64MW more than December 2023's 4624MW; meanwhile, wind capacity grew by approximately 500MW during 2024 and 2025.
Is wind generation being "lost" during these times of high availability? Our preliminary dispatch down figures for February suggest there was very little dispatch down on February 14, so in this case, constraints and curtailment did not prevent a higher record from happening.
It's also worth nothing there were several other days in February with a similarly high availability of wind power to February 14. However, those other days were impacted by dispatch down, chiefly transmission constraints (meaning there were issues getting power out of the areas with wind farms to where it was needed, as opposed to some overall system limit).
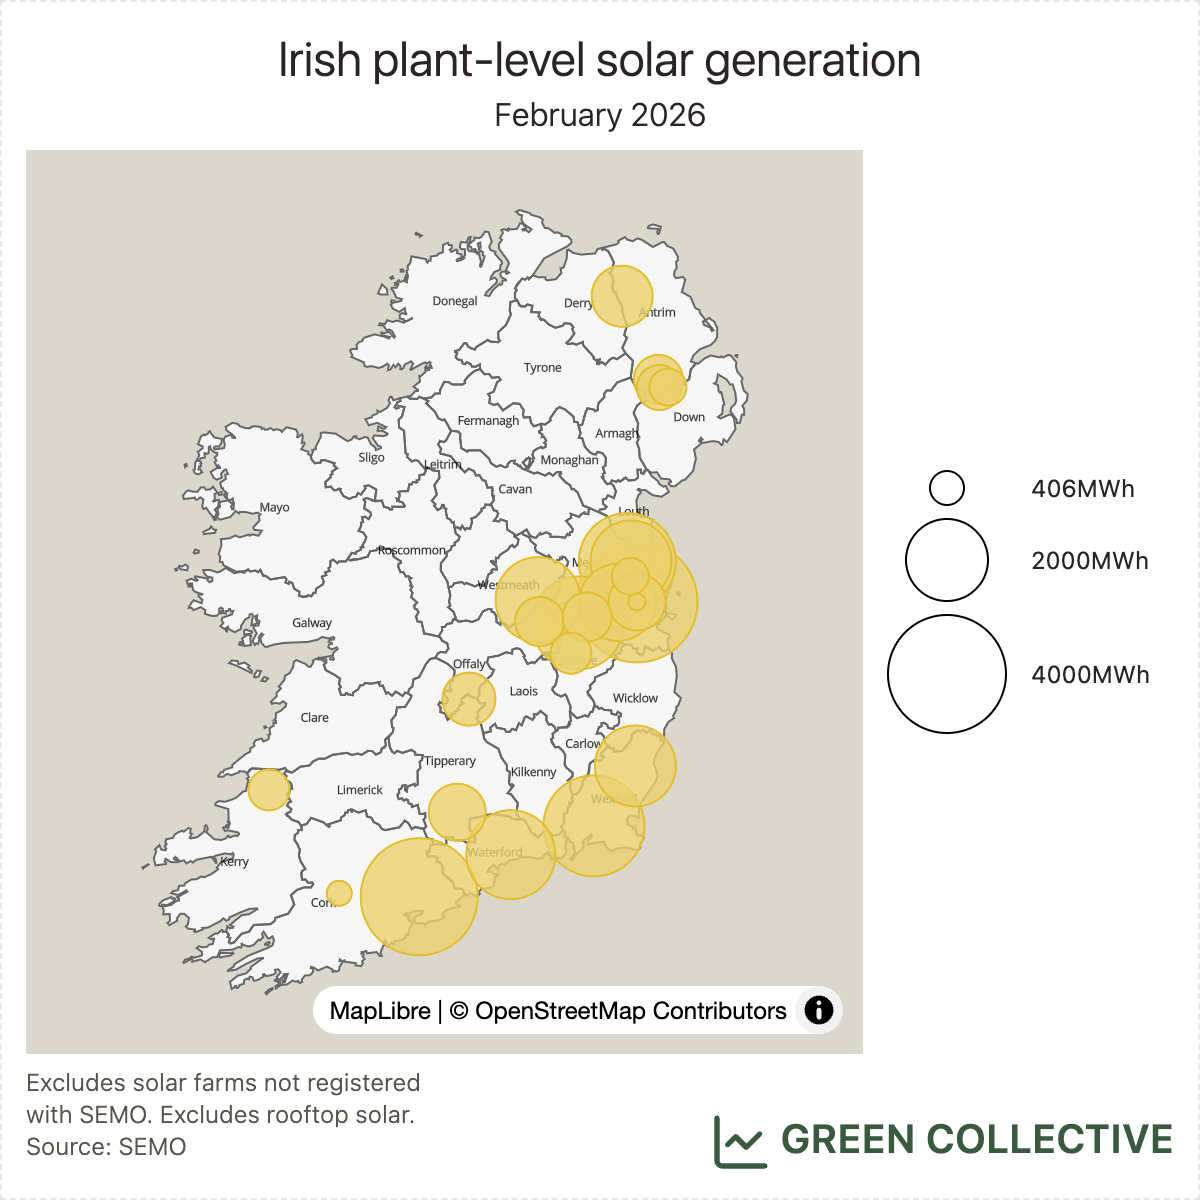
Solar
Solar generation fell approximately 8% from February 2025, the latest such year-on-year fall reported here in recent months. This is still a little surprising given the new capacity coming online (more on which below) but we should bear in mind that winter is never going to be the best time for solar in Ireland.
On the bright side, solar is already picking up: on February 28, output reached almost 650MW – equivalent to approximately 13% of the island's entire demand around noon. These were record numbers in the summer of 2024 which, less than two years later, we're now seeing in winter.
One new solar farm started exporting to the grid during February: Rathlockstown, in County Meath. Meath has long been the top solar-producing county by some distance and, although peaking so far at just 6MW, this 18.9 MW farm (seemingly another extension at Gallanstown) is set to help maintain its lead in 2026.
On this topic, last month we highlighted Clonfad which finally added County Westmeath to our map. However, we missed two other new solar farms which also started exporting to the grid during January:
- Erkina is Tipperary's second utility-scale solar farm, adding 66.6MW to the 20MW at Monaraha. There is also an extension solar farm at Erkina of 90MW that also appeared in SEMO's list in January 2026, but we haven't seen any export activity at the extension solar farm just yet.
- Drombeg is Kerry's first utility-scale solar farm. In terms of renewable rankings, Cork typically beats Kerry thanks to its solar and hydro production in addition to wind. Drombeg's 50MW capacity is unlikely to change that anytime soon but we very much welcome the (belated) arrival of solar in a county which must be virtually as sunny as neighbouring Cork, the current #2/#3 solar-producing county.
That's five new solar farms in total so far this winter, raising the island's capacity from 1,095MW in summer of 2025 to 1525.5MW as of March 1, 2026. Assuming dispatch down doesn't escalate, we should again see ~50% year-on-year growth as we have over the past few years. Last year, we correctly predicted a "solar record season" running March-September. This record season has been slowly expanding, too, so with all this new capacity, we predict a new solar record in the first half of March 2026. We'll let you know in the next newsletter!
Storage
10.7GWh from discharging batteries was equivalent to 0.3% of the island's electricity demand. This was more than twice February 2025's 4.1GWh and the third-highest ever monthly total. This should come as no surprise considering the grid's new dispatch programme for batteries which launched in November (described at length in previous newsletters).
However, this was significantly down from January's 16.2GWh. There was more wind generation in February than January, which means revenue potential from DS3 Programme was higher last month. This explains the decrease in discharging batteries in February compared to the records we’ve seen in January, as more batteries opted to remain available for ancillary services rather than participating in trading.
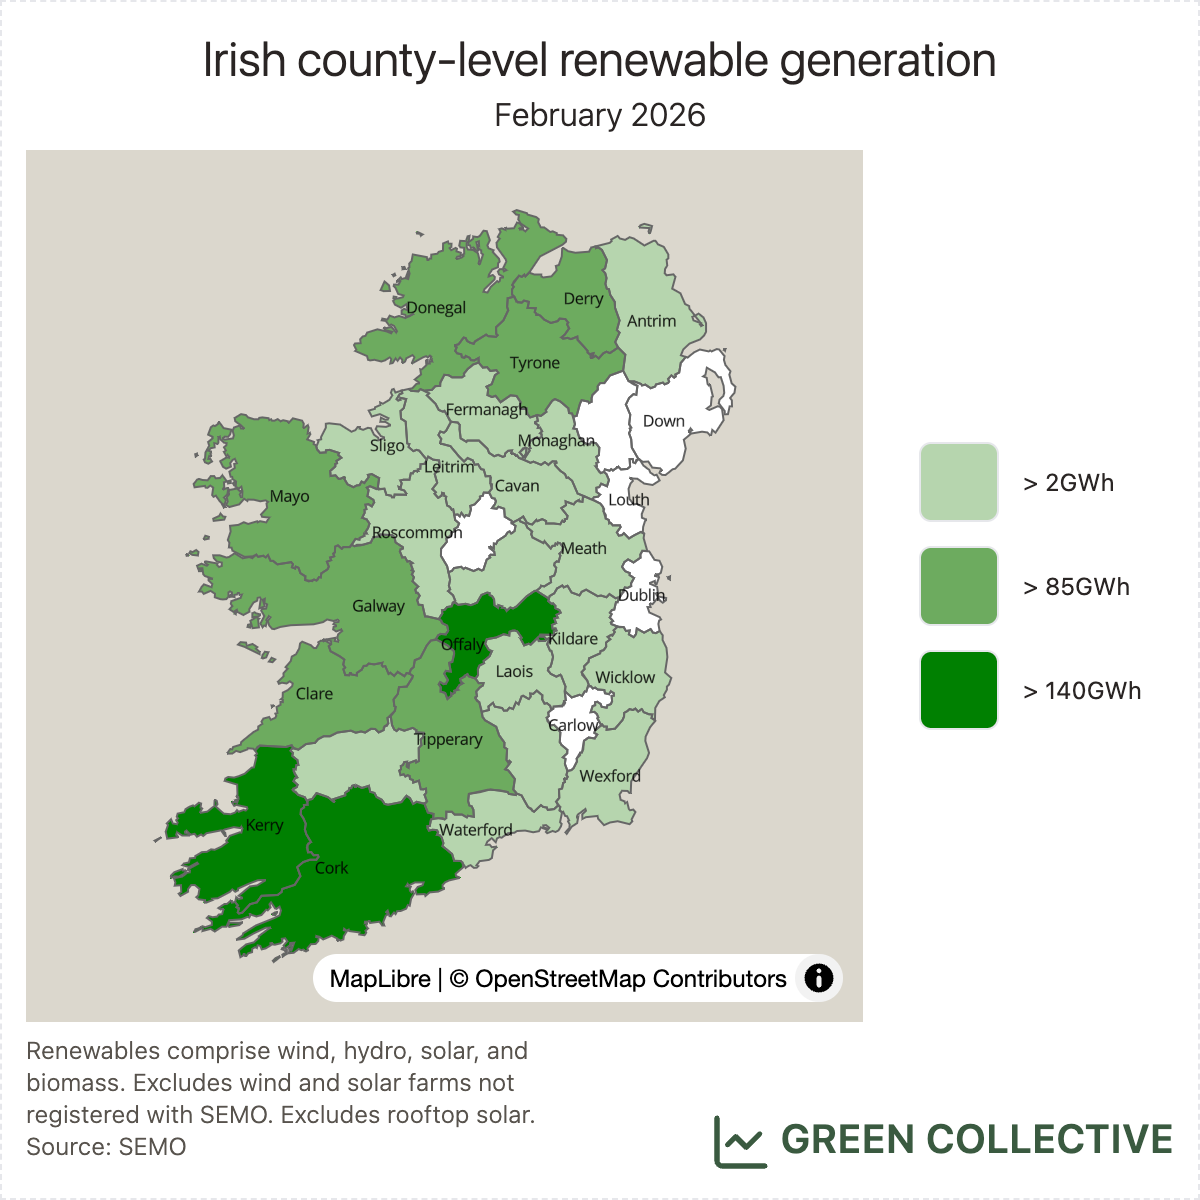
County-level analysis
The top five renewable-producing counties during February 2026:
- Kerry
- Cork
- Offaly
- Clare
- Donegal
Following Offaly's exceptional wind performance during January, things were back to normal: Cork and Kerry jostle for the top two positions, pushing Offaly back into #3. We've crunched the numbers and while there are indications of increased dispatch down in Offaly during February, we continue to believe it was simply exceptionally windy in Offaly during January.
Clare is the real surprise here: home to several medium-sized wind farms, its promotion to the top five this month is entirely due to Ardnacrusha which, presumably thanks to winter rainfall, was the #2 renewable-producing plant (of any type) on the island during February, producing over 50GWh. This put it behind only Oweninny in County Mayo, the island's largest wind farm. Not bad as Ardnacrusha enters its second century of operation!
Fossil fuels and carbon emissions
Fossil fuel generation totalled 1446.4GWh, or 39.9% of demand. Fossil fuel generation typically totals less than 50% of demand in February months (2023 is the only exception in recent years) but, following up on last month's newsletter, we can report that fossil fuel generation has now fulfilled less than 50% of demand every single month since August 2025.
A full breakdown of fossil fuel generation:
- gas: 1388.8GWh / 38.3% of demand
- oil: 9.5GWh / 0.3% of demand
- waste-to-energy: 48.1GWh / 1.3% of demand
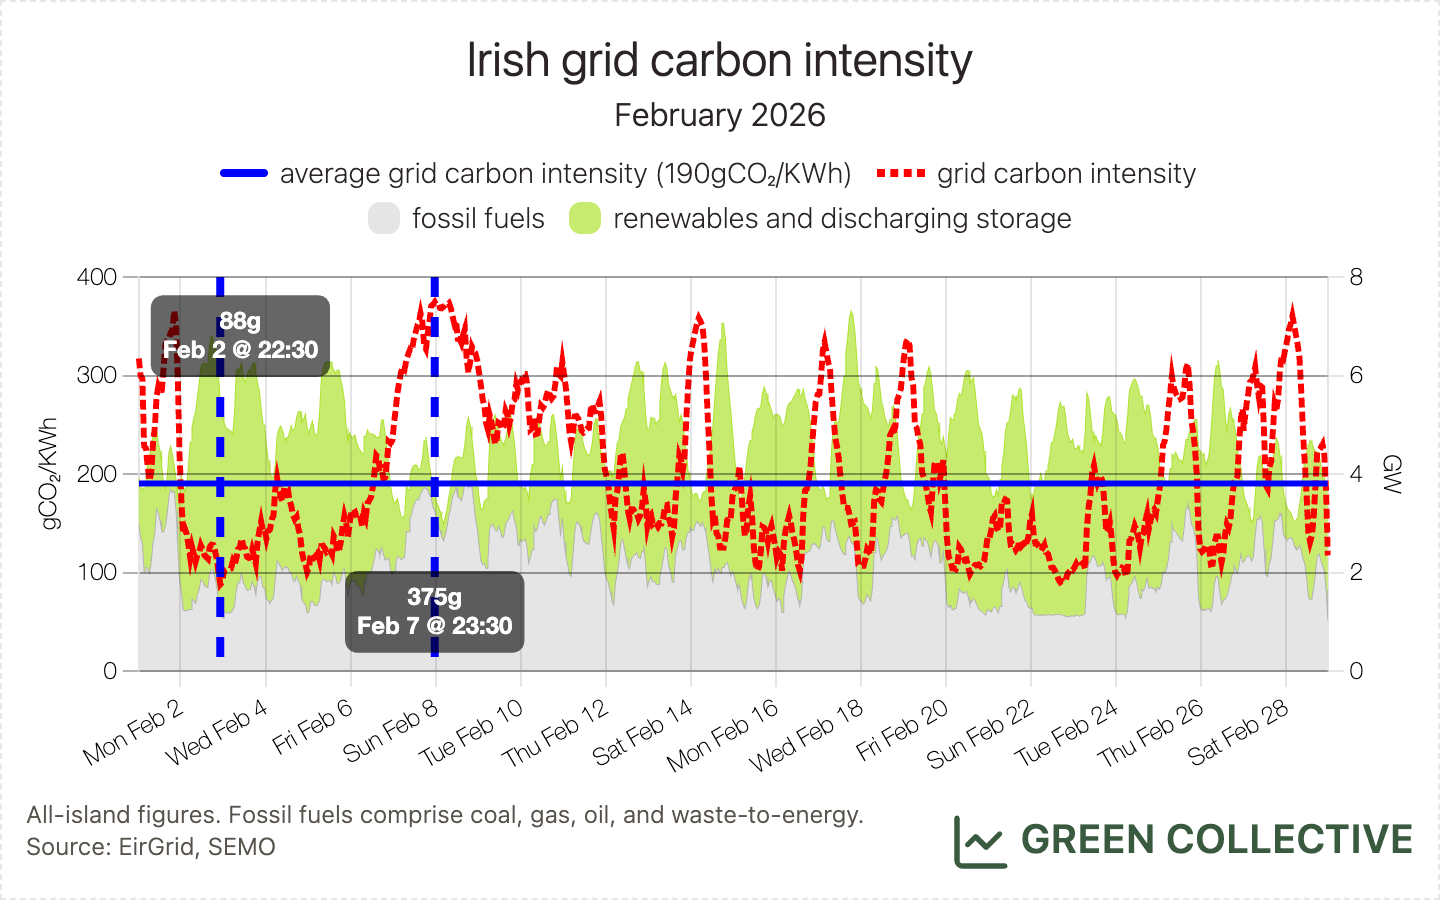
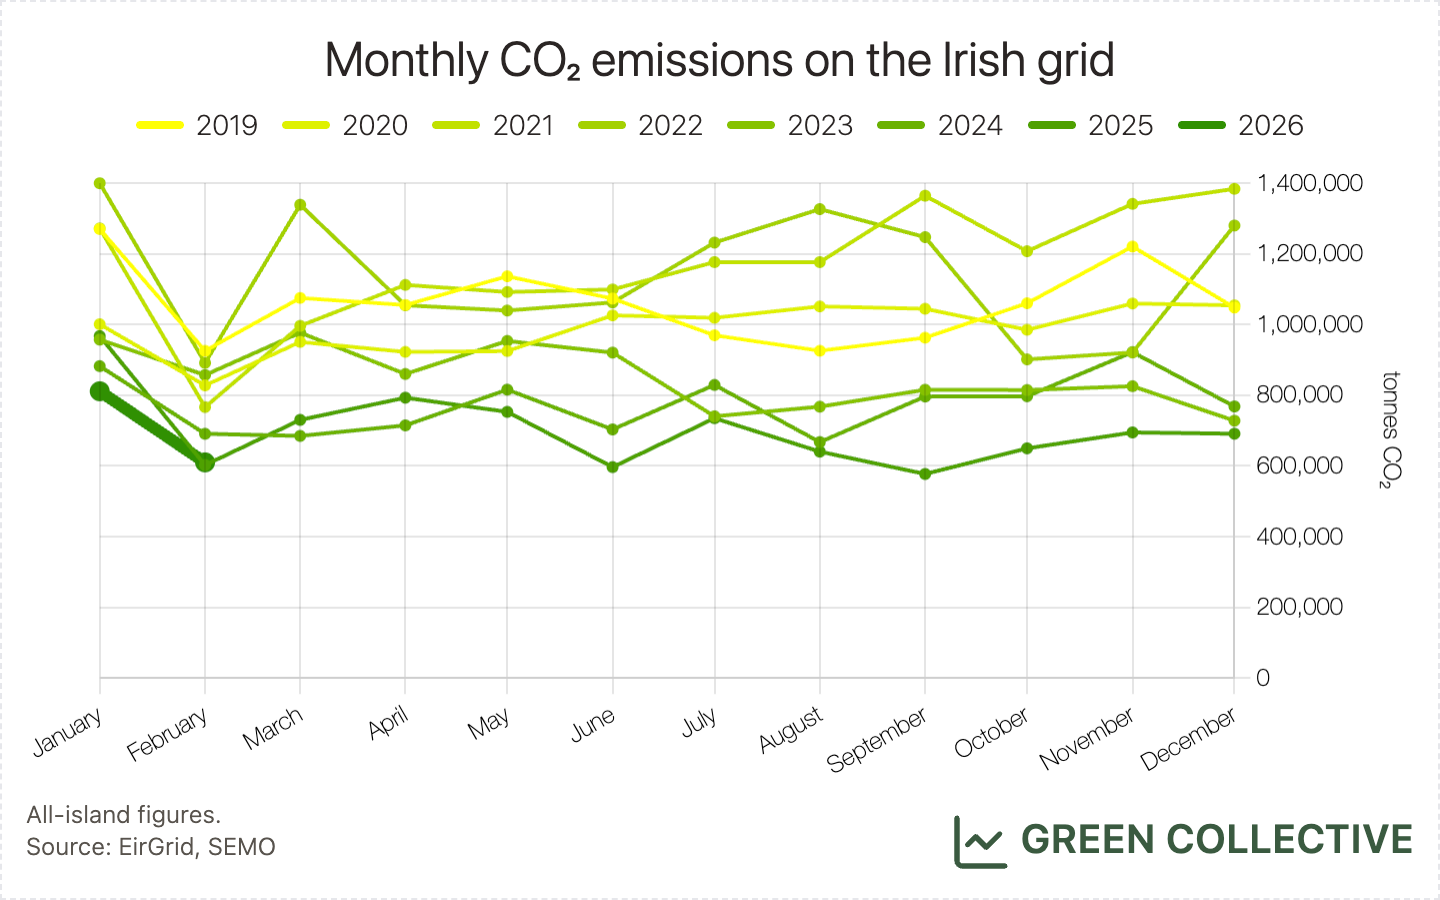
We estimate that during February 2026 the Irish grid emitted approximately 610,000 tonnes of CO₂, ranging between 88g and 375g of CO₂ for each kWh of electricity generated for an average grid carbon intensity of 190gCO₂/KWh.
One year ago, we hailed the arrival of the new Greenlink interconnector as "a new normal for carbon emissions in Irish electricity". This was borne out during the remainder of 2025, which saw the grid emitting the lowest amount of CO₂ emissions in modern times: approximately 8.4M tonnes, roughly 30% less than in 2020. And this in the face of ever-rising demand. As Greenlink enters its second year of operation, an era of "easy" year-on-year carbon-related records comes to an end.
Both tonnage and average grid carbon intensity were a smidgen more, year-on-year, from February 2025's 602,000 tonnes and 187gCO₂/KWh. This unfortunately means the remarkable six-month streak of all-time carbon emission lows we reported last month has ended – but it's only by a hair, and is to be expected as Greenlink enters its second year of operation.
Hatches and Dispatches
- It's March, which means the various trade and lobbying organisations have finally published their annual reviews. We're certainly not above being cited in "reporting" on such reviews whenever our data is involved. However, we invite you to look for any major differences between this article on RTÉ's website and the original press release from Gas Networks Ireland. We're particularly impressed that the extremely detailed, month-by-month rise and fall of gas made the leap. What would we add in the way of actual reporting? Perhaps that 2025 was gas' lowest-ever share of demand in the ROI, with correspondingly lowest-ever carbon emissions in modern times (see our annual review, from January 1).
- An additional 118.9MW of solar farms joined SEMO's registered unit list during February: Ballymoneen Solar Farm in Galway (100MW) and Rathlockstown Solar Farm in Meath (18.9MW – already generating, as mentioned in the solar section, above). Again, fingers crossed we'll see a solar output record in March!