Irish Grid Monthly Recap, January 2025
January 2025 was for us bookended by extreme weather events (exacerbated by climate change) that exposed vulnerabilities in the critical infrastructure serving our loved ones. Close friends had to evacuate their home in Altadena in early January due to the Eaton Fire in Los Angeles; it burned down less than 24 hours later. We were glued to NASA’s FIRMS (Fire Information for Resource Management System) map (essentially a “fire map”), unlocking a whole new level of doomscrolling.
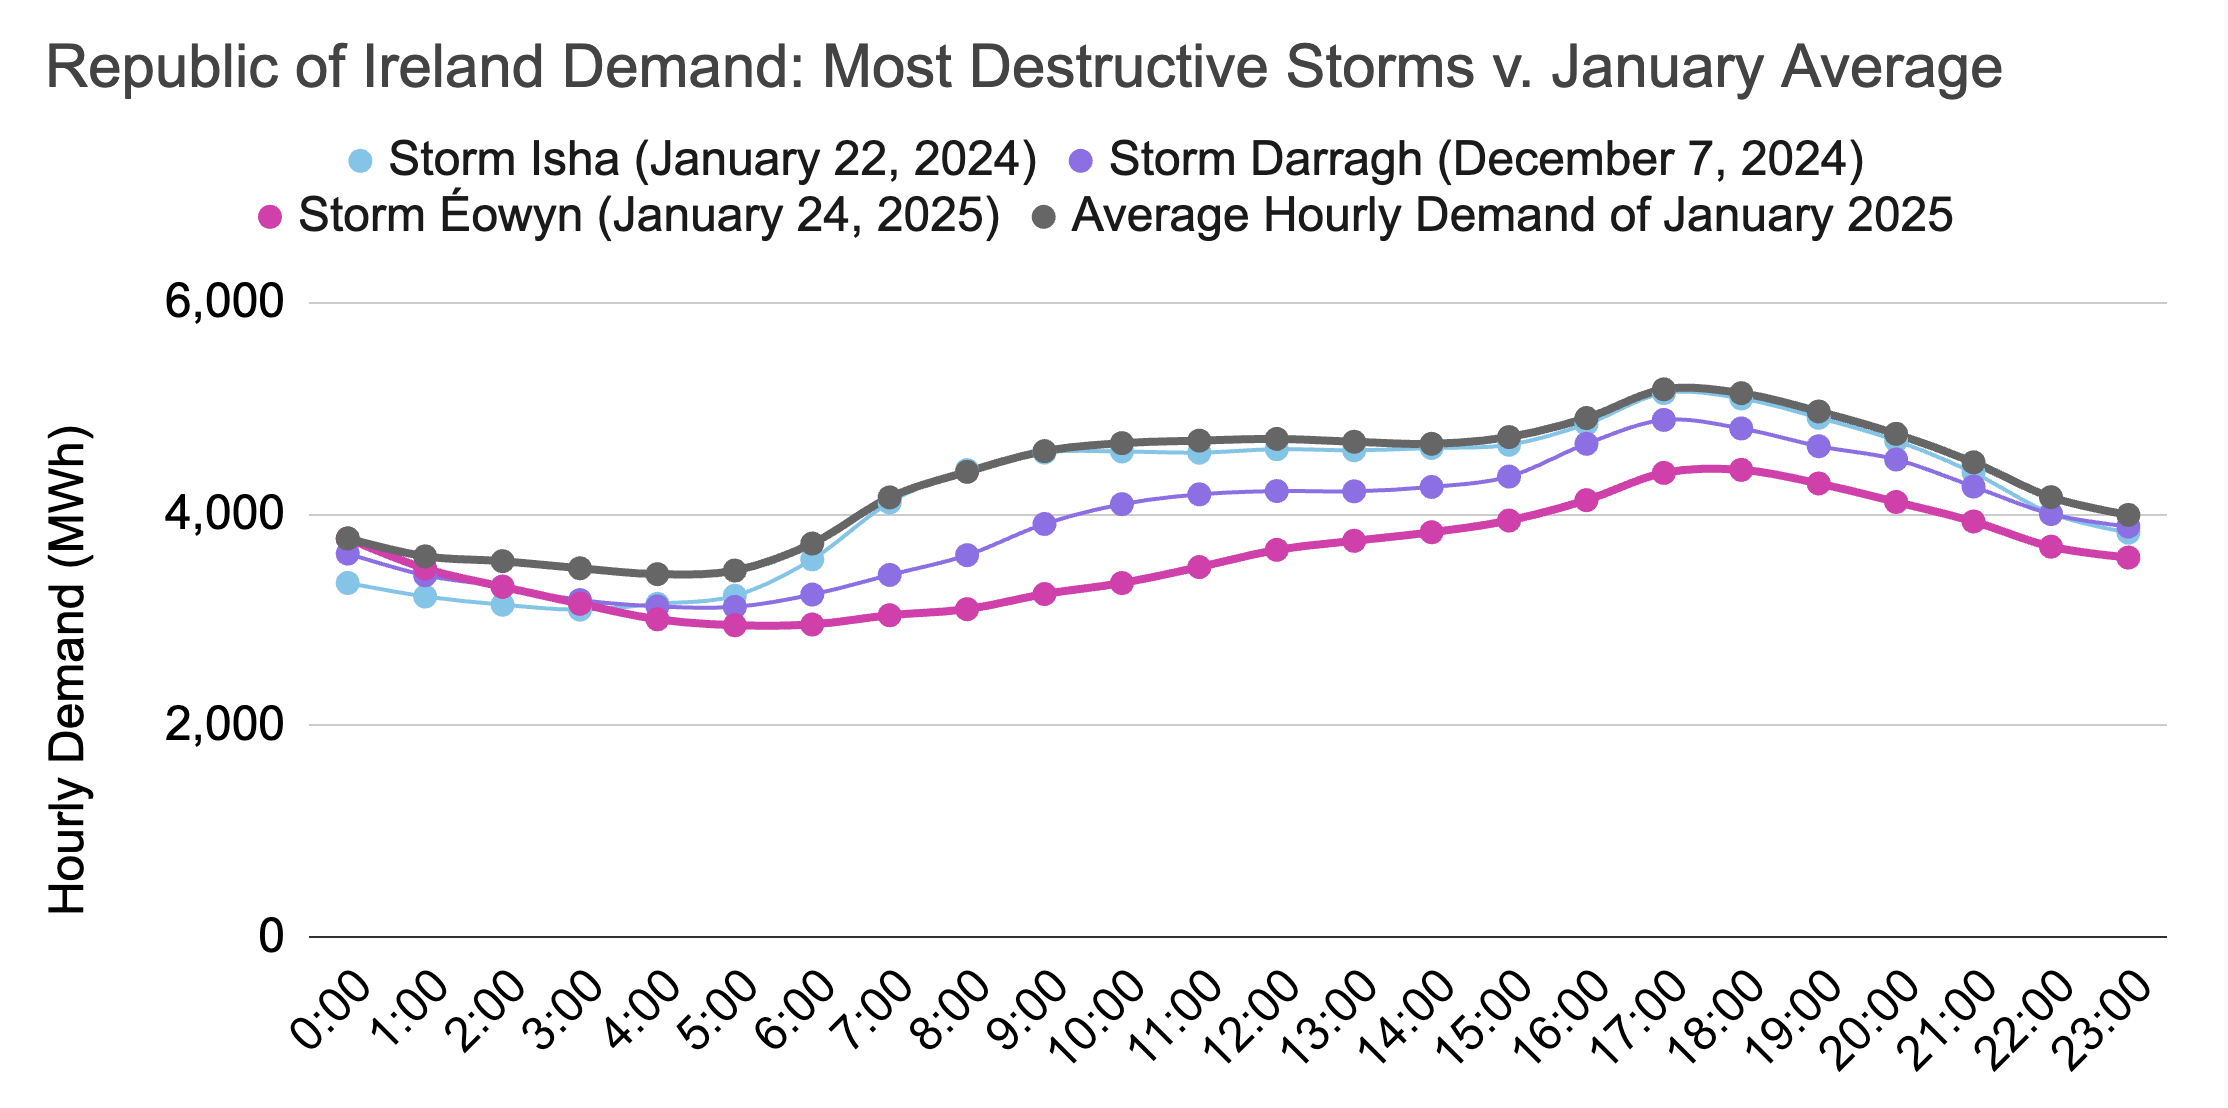
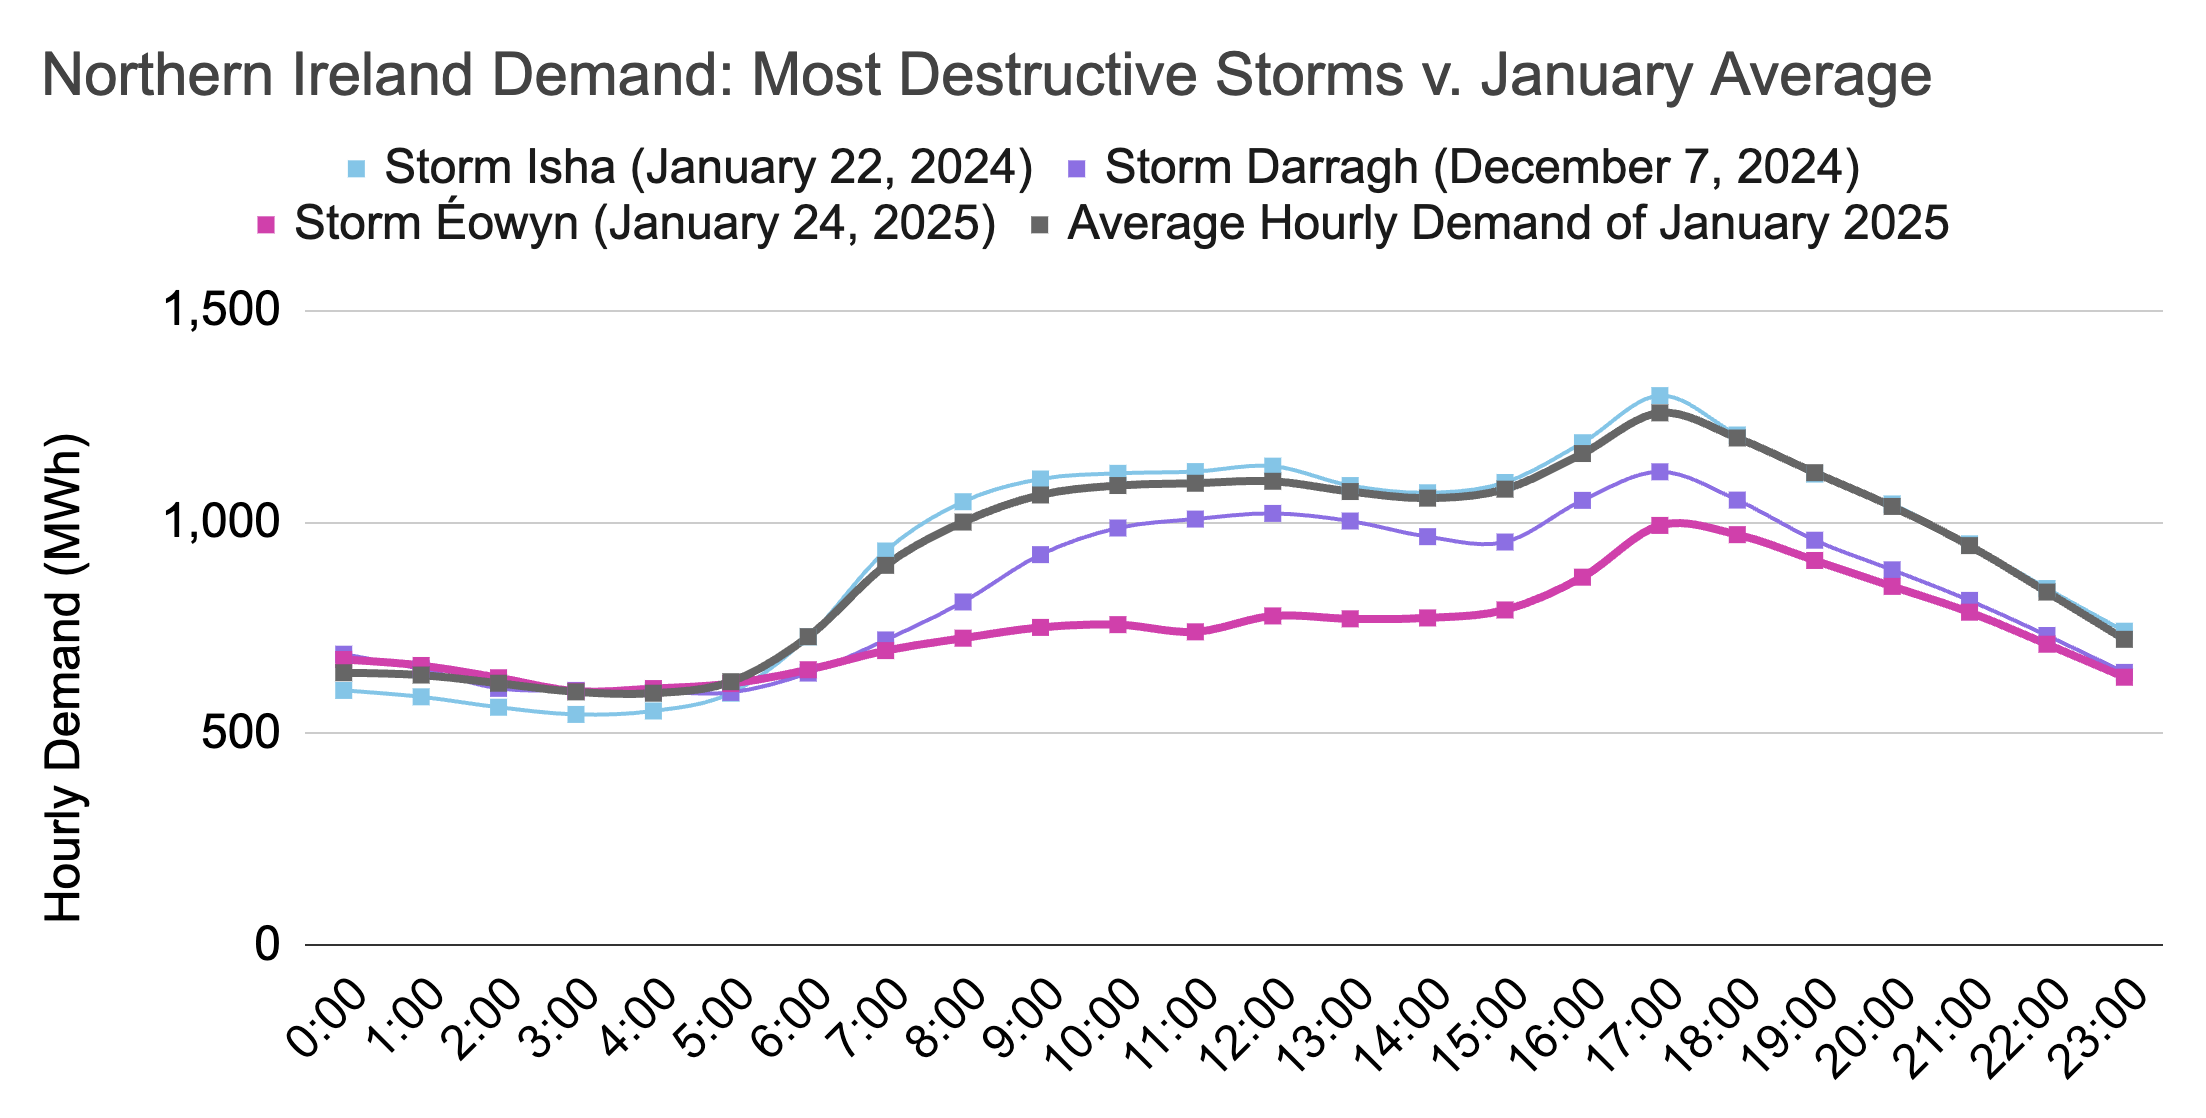
On the Irish side, after wintry conditions in early January (a new all-island peak demand record of 7497MW was set on January 8), Storm Éowyn battered the island last week and left more than a million homes and businesses on the island without power: 768,000 in the Republic of Ireland (ROI) and 282,000 in Northern Ireland (NI). Previous destructive storms include Darragh (December 2024) and Isha (January 2024) which disconnected 395,000 and 235,000 customers respectively in ROI. We took a look at demand during these storms and the sharp decline during Storm Éowyn is unquestionable, as its demand curves sit much lower even than other strong storms. At one point, more than 30% of customers were disconnected on the island, an unprecedented level.
As restoration efforts continue in earnest, we hope those still without electricity get reconnected soon and can remain safe in the meantime. At the time of writing, 63,000 customers are still without power according to ESB Networks, down from 768,000 (a 92% drop) when the storm first hit. These are quite literally last-mile restoration efforts, as the outage map shows each fault now rarely affects more than 100 customers at a time and many only affect fewer than 20, indicating the isolated nature of such locations.
The evergreen sentiment of "oh this wouldn't be happening if it was Dublin" has been making the rounds but the reality is that higher population density is correlated with more infrastructure resilience and makes restoration efforts more efficient. It takes a lot longer to bring back power to more remote and sparsely populated communities, and particularly to those in one-off houses. This destructive storm certainly highlights the need to reinforce and adapt grid infrastructure; just as importantly, however, it exposes the vulnerability of low-density housing and serves as a reminder of what we may need to change in order to cope with climate change.
Now, onto our usual programming - don't worry, it includes quite a few positive findings.
Summary
Domestic renewable generation during January 2025 was equivalent to 36.9% of all-island electricity demand:
- 32.6% wind
- 2.1% hydro
- 1.6% biomass
- 0.7-0.85% solar
Despite all-time record biomass generation, wind generation - comprising the overwhelming majority of renewables - was lower than usual for a January month and 1444GWh in total from renewable sources was lower than January 2020, 2023, and 2024.


Wind
Wind generation was lower than usual for this time of year. The two chief reasons were:
- a cold snap earlier in the month during which there was barely any wind
- Storm Éowyn towards the end of the month during which many wind turbines had to shut down, at least for some time (typically, when wind speed exceeds 25m/s or 90km/h)
1273.1GWh was only the 5th highest amount of wind generated during a January month. This was equivalent to 32.6% of all-island demand, the 6th highest wind/demand ratio yet seen during a January month. Notably, we saw in excess of 1.4TWh from wind during a January month as long ago as 2018.
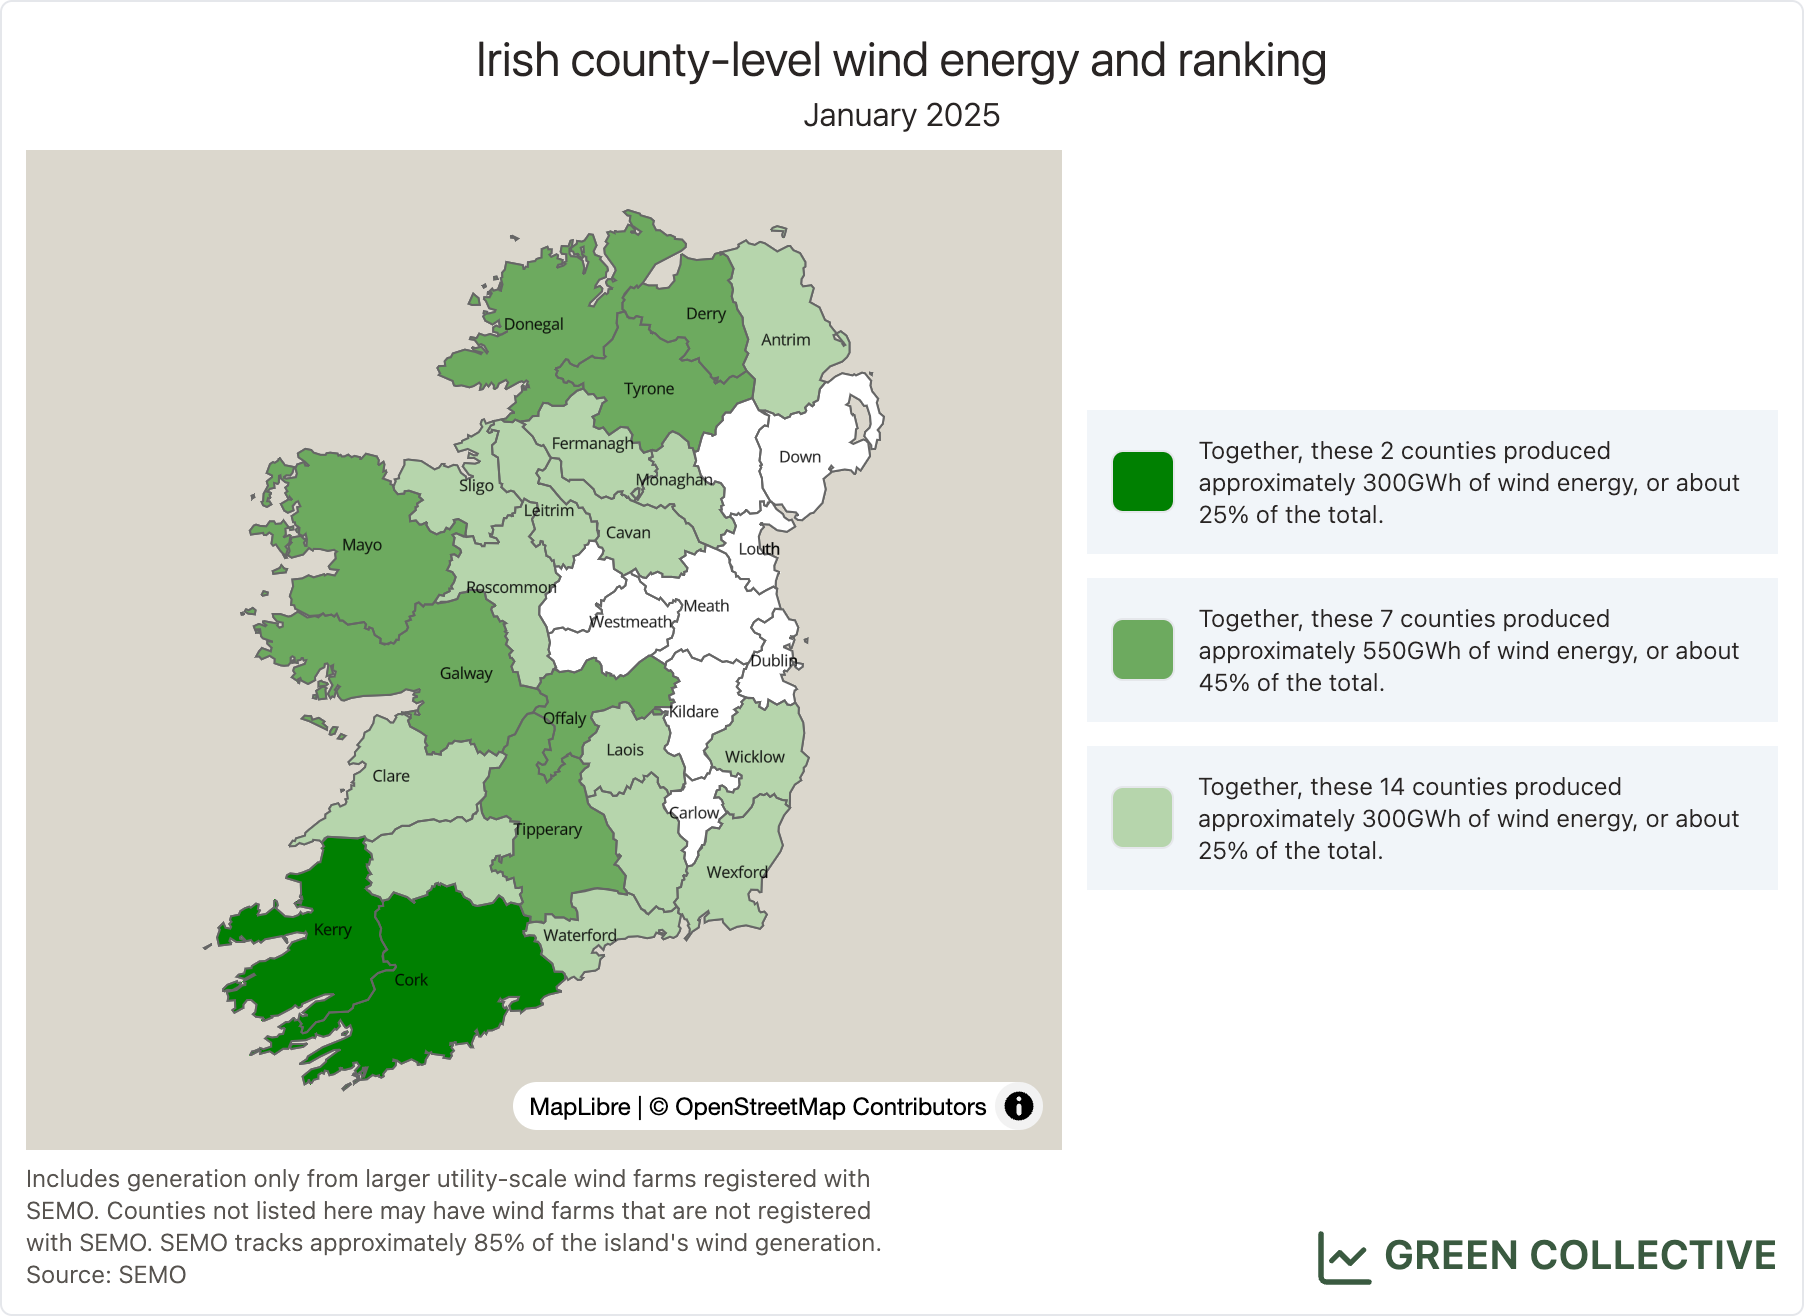
The top five wind producers for the month were (in descending order of MWh):
- Cork: 150GWh
- Kerry: 147GWh
- Offaly: 93GWh
- Tipperary: 82GWh
- Galway: 81GWh
Cork and Kerry were, as usual, the two top wind producers by some distance and together accounted for approximately 25% of all wind generation. Offaly was #3 wind producer for the first time. Offaly placed as #3 renewables producer for the whole of 2024 thanks largely to the large biomass plant at Edenderry; however, most of the island's new wind capacity in 2024 opened there, too, and this is now showing itself in the wind rankings. We wrote about renewables in Offaly in our 2024 annual review.
Solar
With solar growing so rapidly, it hardly needs to be said that we saw the most ever solar generation for a January month. However, just to be specific: 27GWh (which we will most likely be able to revise to approximately 30GWh once EirGrid releases complete utility-scale numbers) represents - for the second month in a row - a >50% year-on-year increase.
By the end of the month, daily peaks have been exceeding 400MW, equivalent to >7% of all-island demand at the peak around noon. We haven't seen these levels of solar since October and if we look back on 2024, solar didn't reach these levels until April, after which solar started breaking records all the way through to the end of August. Several new large solar farms which came online this winter are making a difference and we shouldn't be too surprised if a new solar output record (currently at 719MW) is set during the spring.
The top three solar producers for the month were (in descending order of MWh):
- Meath: 13GWh
- Wexford: 5GWh
- Cork: 3GWh
These top 3 county rankings for solar haven't changed for months: Meath continues to be the clear leader in solar. However, that lead has narrowed throughout 2024 as new solar farms in Tipperary and Kildare start to make themselves noticed further down the table.
Fossil Fuels
Fossil fuel generation was equivalent to 53.9% of the month's all-island electricity demand. This was up from January 2024's 50.1% but still hugely down from the 65%+ seen in 2022.
Gas - which we rate as the "least dirty" of the fossil fuels in play on the Irish grid - comprised approximately 90% of fossil fuel generation. However, coal clings stubbornly on: while low by historical standards, output at times exceeded 500MW and >100GWh was the highest monthly total since July.
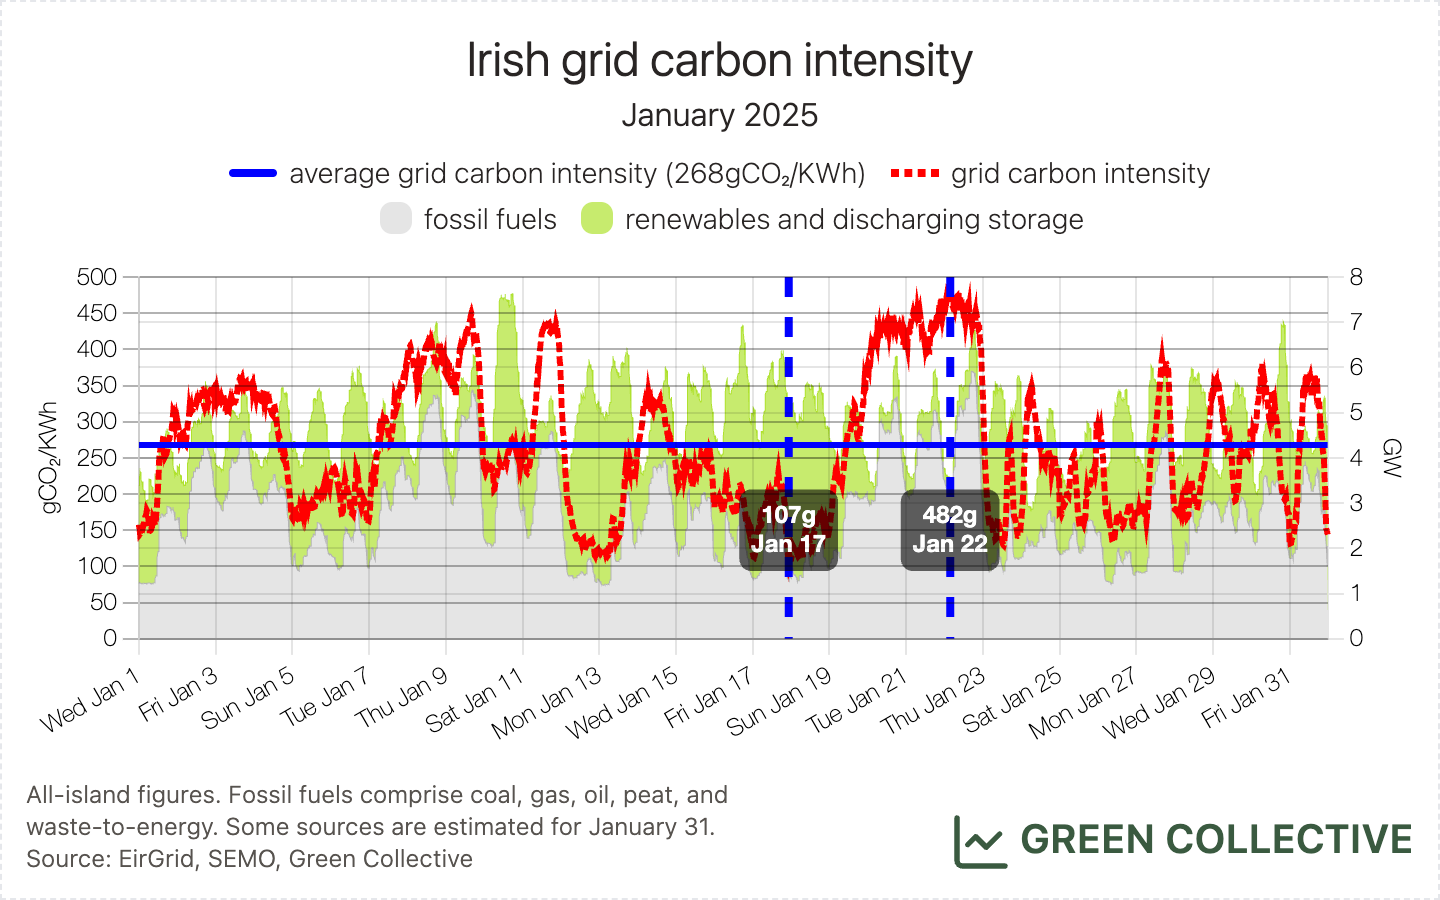
We estimate that for each kWh of electricity generated during January 2025 the Irish grid emitted between between 107g and 482g of CO₂, for an average of 268gCO₂/kWh. This was the second-lowest grid carbon intensity observed during a January month.
Looking at the two jurisdictions separately for a moment, grid carbon intensity in the Republic of Ireland averaged 267gCO2/kWh, while Northern Ireland averaged 278gCO2/kWh.
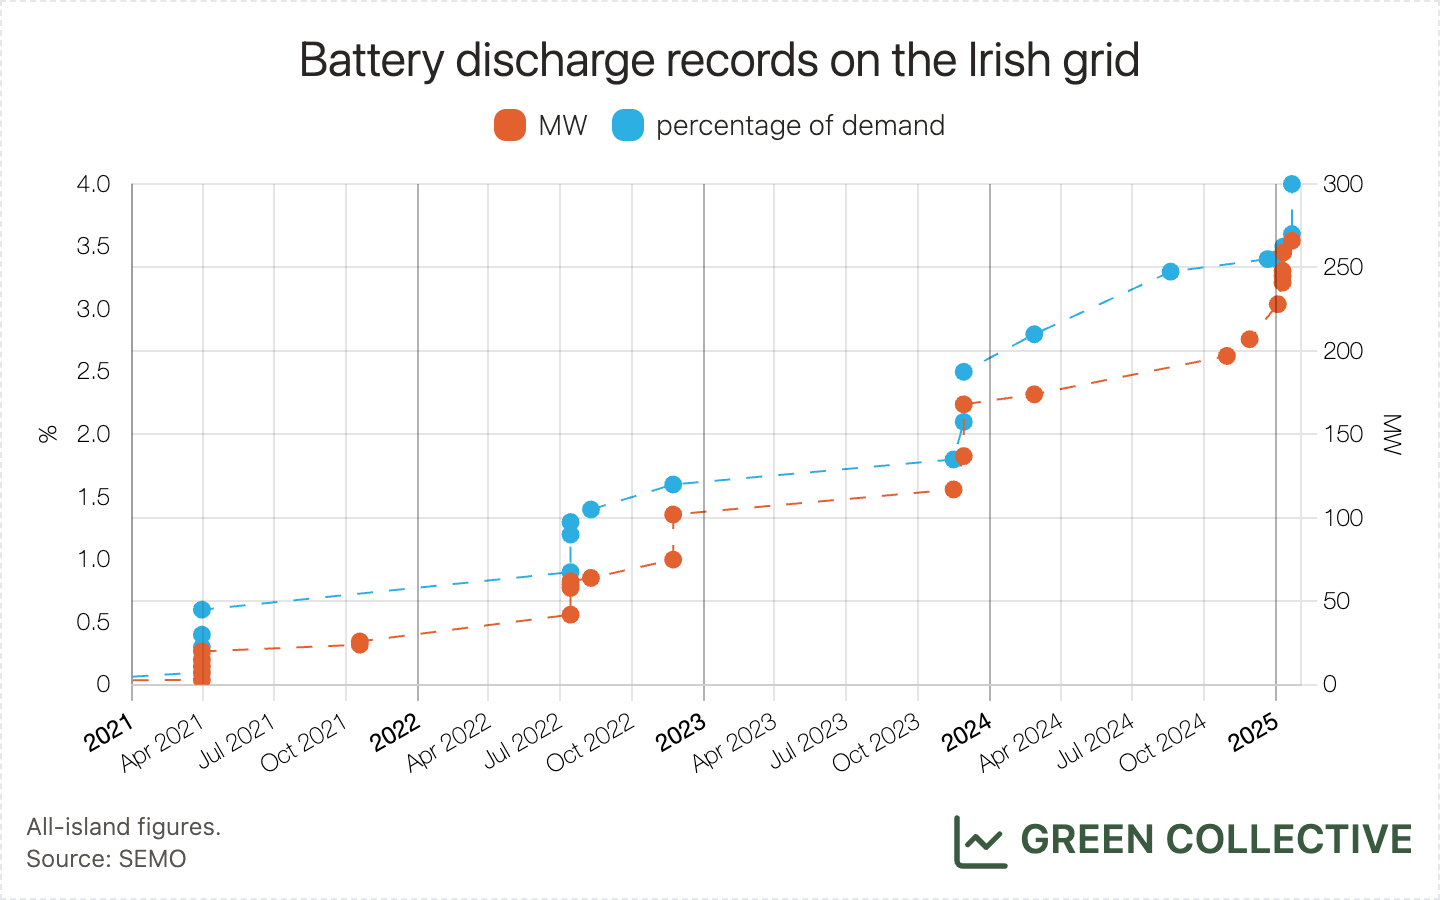
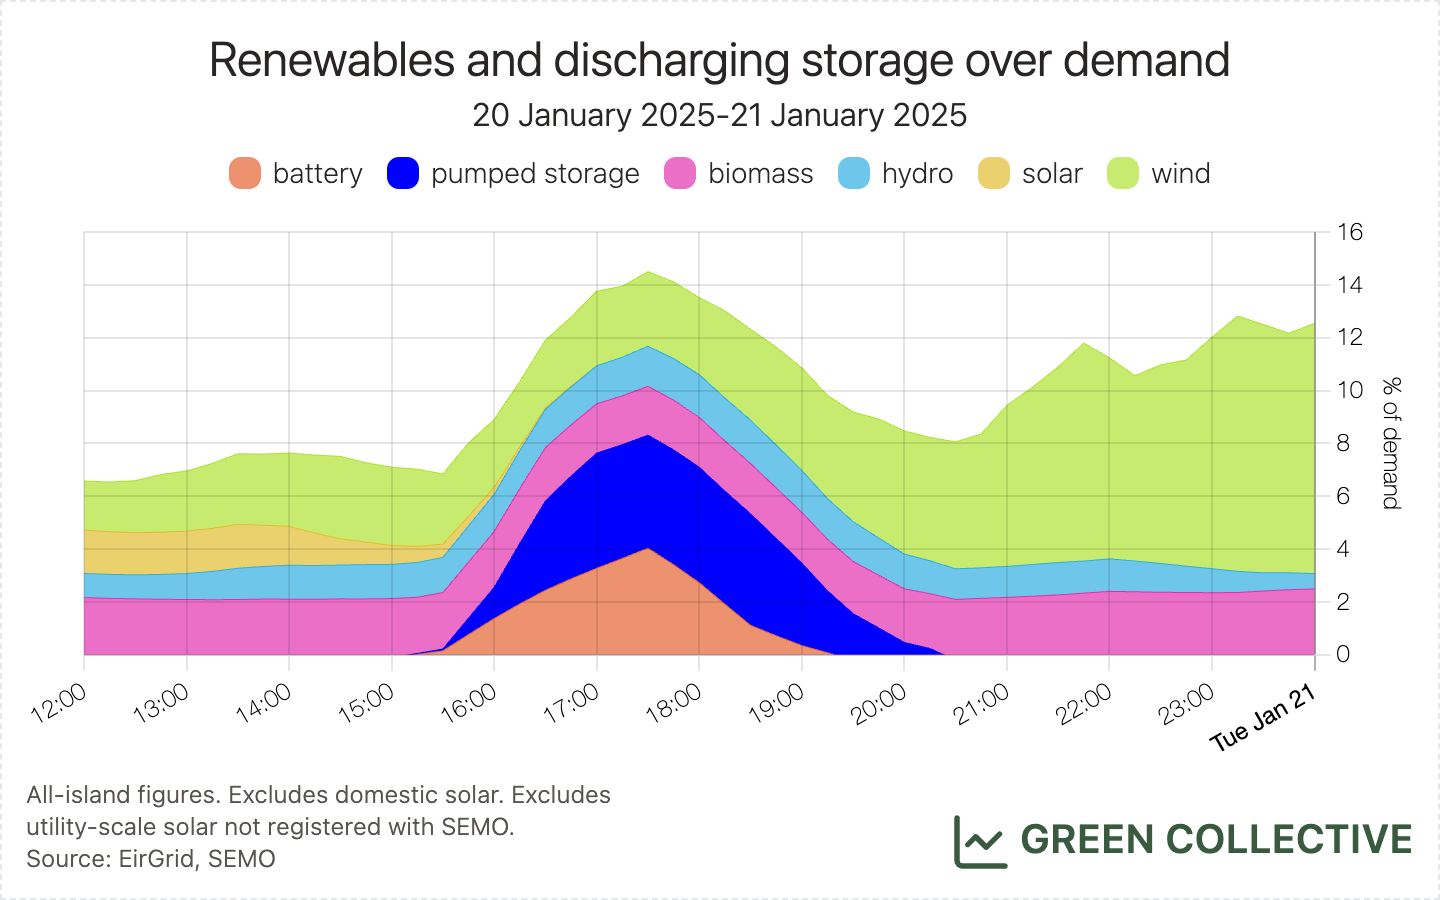
Storage
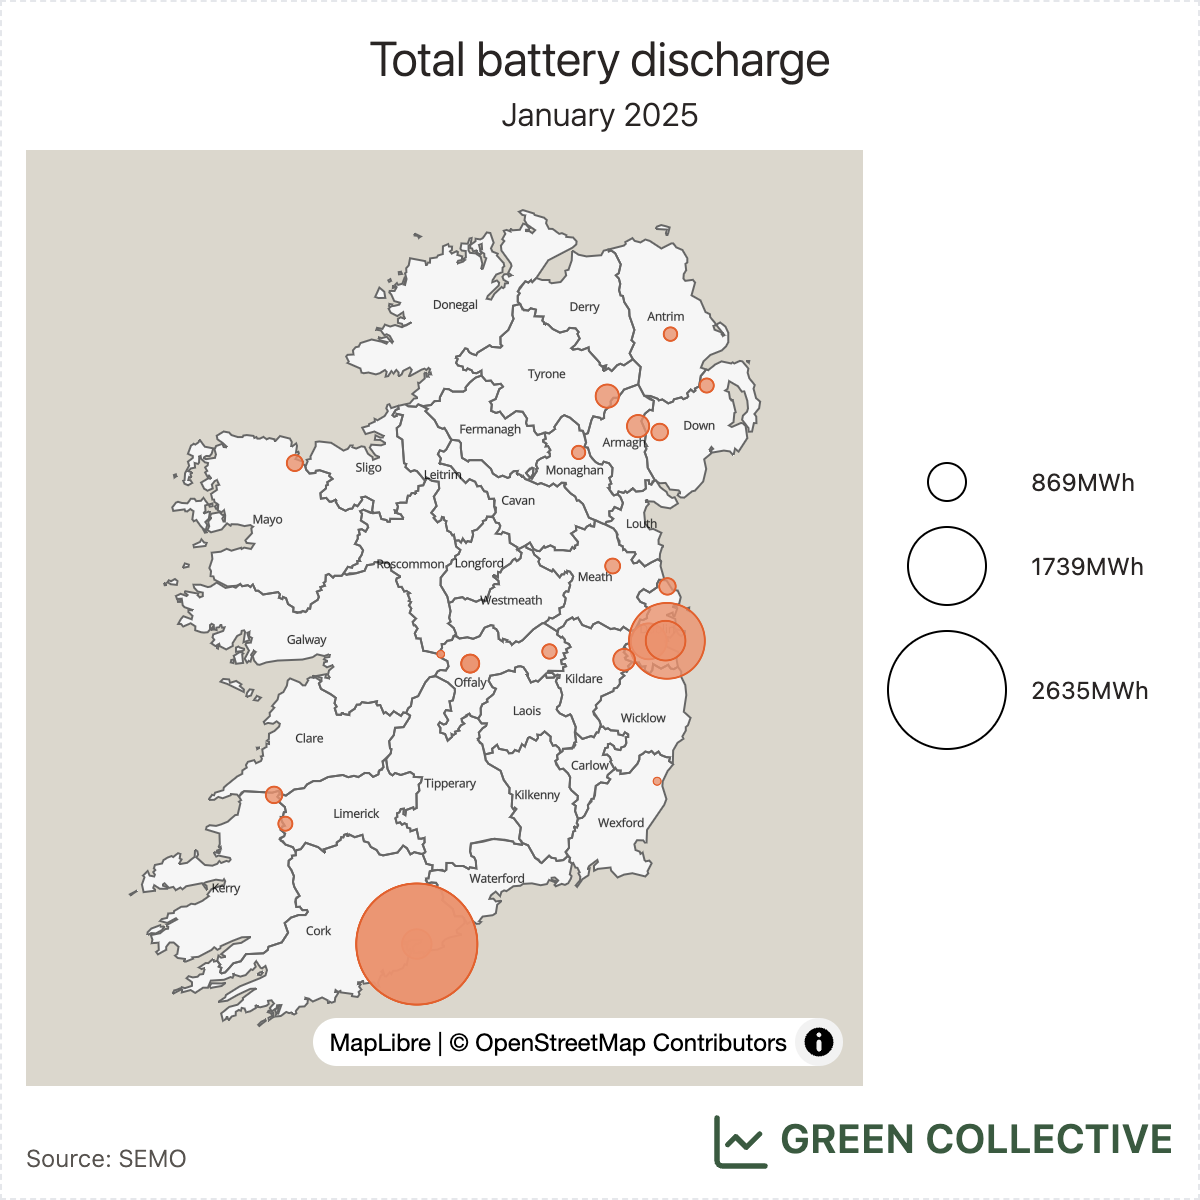
Batteries continue to contribute more and more to peak demand and broke discharge records no fewer than four times during January, peaking at 266MW on January 20th. This was equivalent to 4% of all-island demand at the time, also a new record on the Irish grid. We wrote about how incentives for battery owners changed late last year and this result is surely a welcome change if it helps displace gas generation during peak load. The island's total battery capacity is around 1GW/1GWh and we look forward to continuing market and technical improvements getting us close to that during peak load. Currently, battery plants in Cork and Dublin are the most active.
Adding Turlough Hill, total storage discharge exceeded 500MW on the Irish grid for the first time this month.
Hatches and Dispatches
The Greenlink Interconnector
The island has been importing more and more of its electricity over the last few years, a trend set to continue with the Greenlink Interconnector between Wexford and Wales having finished testing this month and officially entering the market on January 30th. With a 500MW capacity matching the Moyle and East-West interconnectors, the island's import/export capacity is now 1.5GW: about 25% of the average demand we've been seeing during these winter days.
All three interconnectors were working at full power for much of January 31 and this indeed was by far the most electricity Ireland has ever imported "during the day" (8am-8pm), and equivalent to almost exactly 25% of demand. An interesting aspect worth delving into (and we shall soon) is the relationship between imports and dispatch down of domestic renewable generation. While we would like ultimately to see Ireland exporting more and more when there is excess renewable electricity, the GB grid remains for now significantly lower in carbon intensity than Ireland's.
Yet another solar farm in Meath: Gaskinstown
Gaskinstown Solar Farm registered with SEMO on January 15. With a maximum export capacity of 85MW, this latest solar farm in Meath pushes the county's solar farm capacity past 400MW. In other words, 40% of all solar farm capacity on the island is located in Meath. However, as mentioned previously in the solar section, while Meath's lead is expected to continue, the rankings down the solar leaderboard may change up more this year, as new solar capacity came online in late 2024 in counties like Tipperary and Kildare.
European Electricity Review 2025
You may have seen headlines in various outlets (revealingly, we cannot find this story covered by a single major Irish outlet - please let us know if we're wrong) to the effect that solar generation exceeded that of coal in the EU for the first time during 2024. This was also our finding for Ireland in 2024 - at least once rooftop solar is considered - and indeed we at Green Collective supplied hourly data for the island of Ireland to Ember for use in their "European Electricity Review 2025". We're proud to continue our partnership with Ember; read the full report here.
As always, thank you for reading and please reach out (hello@greencollective.io) if you have any questions or comments.