Irish Grid Monthly: May 2025
Introduction
Be careful what you wish for! In last month's newsletter, we touted a recent rewrite of our solar calculations which have allowed us to include solar in our daily Bluesky reports and identify new records as they're happening for over a year now. During May, EirGrid surprised everyone with an addition to their Smart Grid Dashboard: it finally includes real-time solar.
This may leave our rewrite looking a little superfluous. However, our wish has always been - and continues to be - that EirGrid publish more data and this is undoubtedly a step in the right direction. It's going to save us a lot of work and will allow us to focus on other things. No question: it's better for everybody. Even so, the lack of any notice or consultation with the wider Irish energy community is jarring.
And... just a minor revamp that took 2+ years? We think so. By May 2025, we're already well into the third summer of significant solar growth on the Irish grid. Based on our observations and EirGrid's own LinkedIn posts - plus what we hear through the grapevine - we know EirGrid has had high-resolution, real-time solar data for most of that time. How it could possibly have taken two years to integrate it with the dashboard is unclear. Additionally, the Smart Grid Dashboard remains at a 15-minute resolution (we know they have 1-minute data), still lacks a breakdown of other renewables and fossil fuels, continues to experience semi-frequent outages, and, behind the scenes, has not backfilled any solar data prior to May 20.
While their physical infrastructure may be world-class in many respects (accommodating 75% of inverter-based resources at a time is no mean feat), EirGrid's online and data transparency efforts belong to another age and are, frankly, misguided: spare the effort spent on turning charts into animated GIFs in favour of publishing high resolution data (in any format you like - we've seen it all) and let the wider community and industry do the rest.
And, that's our cue to get off the soap box and into the analysis...
If you like what we do and want to support us, please share this newsletter with your network. Better yet, consider taking out a paid subscription, starting at 5 euro a month or 48 euro a year. Thank you!
Summary
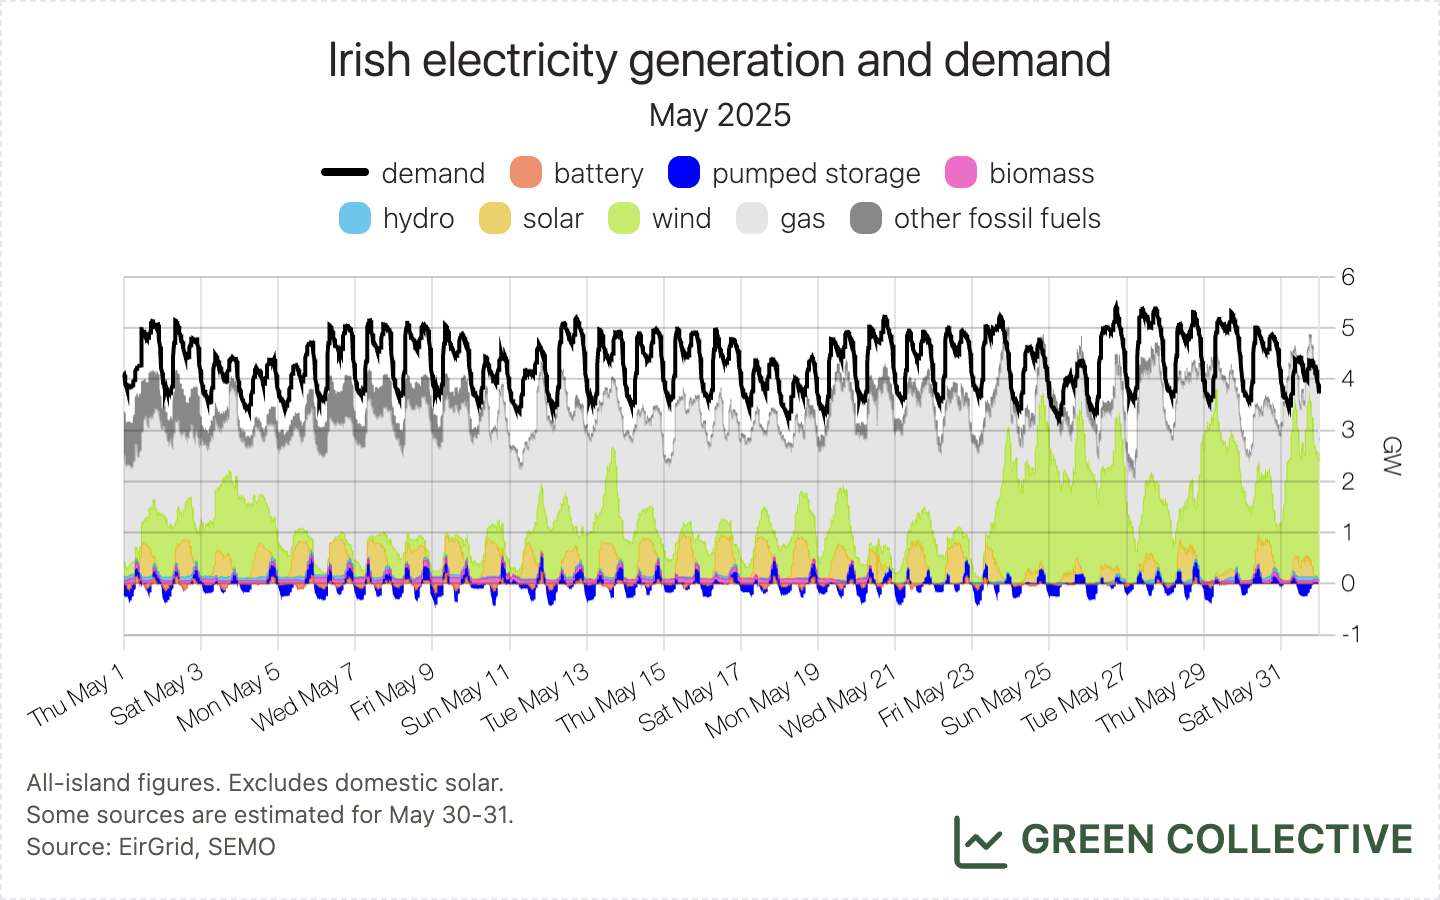
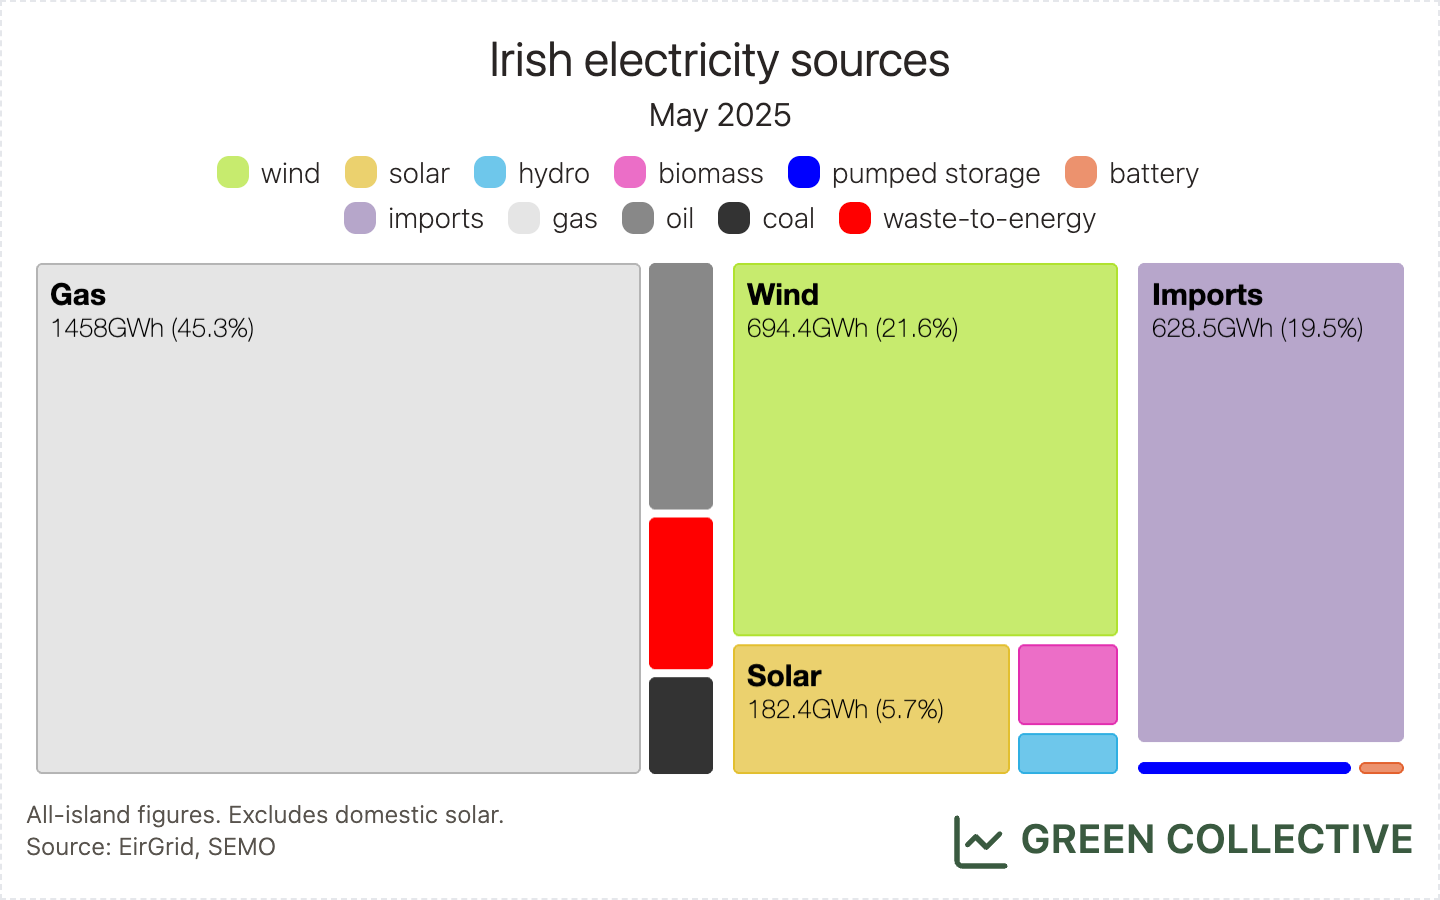
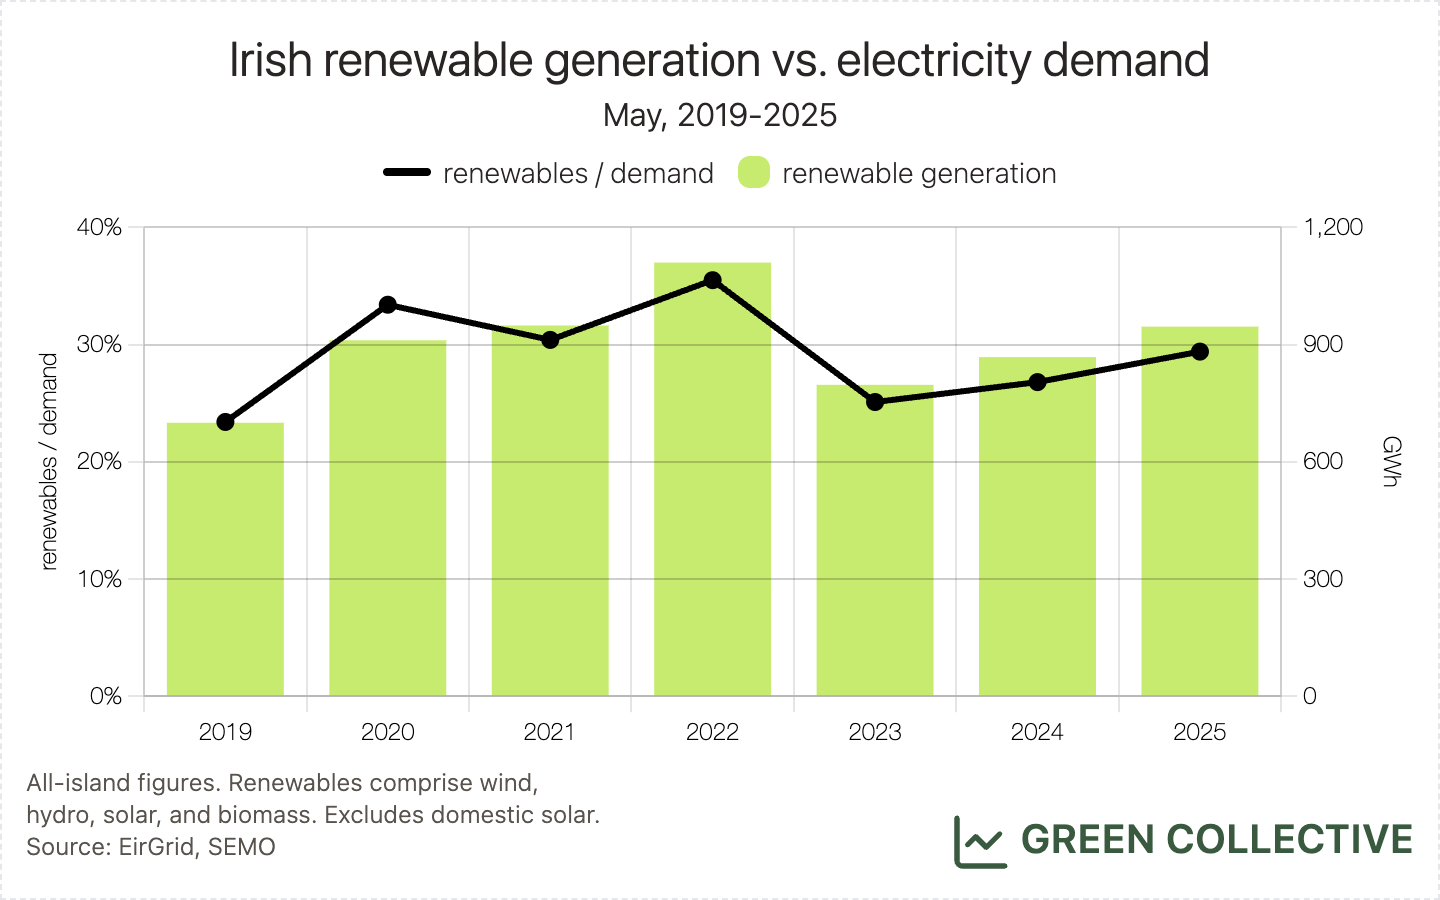
Generation from renewable sources totalled 945.9GWh, equal to 29.4% of electricity demand. Thanks largely to greatly increased solar generation, this represents a healthy year-on-year increase on May 2024's 867.6GWh/26.8%. Coupled with a record amount of imported electricity for a single month helping to push down fossil fuel generation, and this was the greenest May yet for the Irish grid in modern times.
Wind
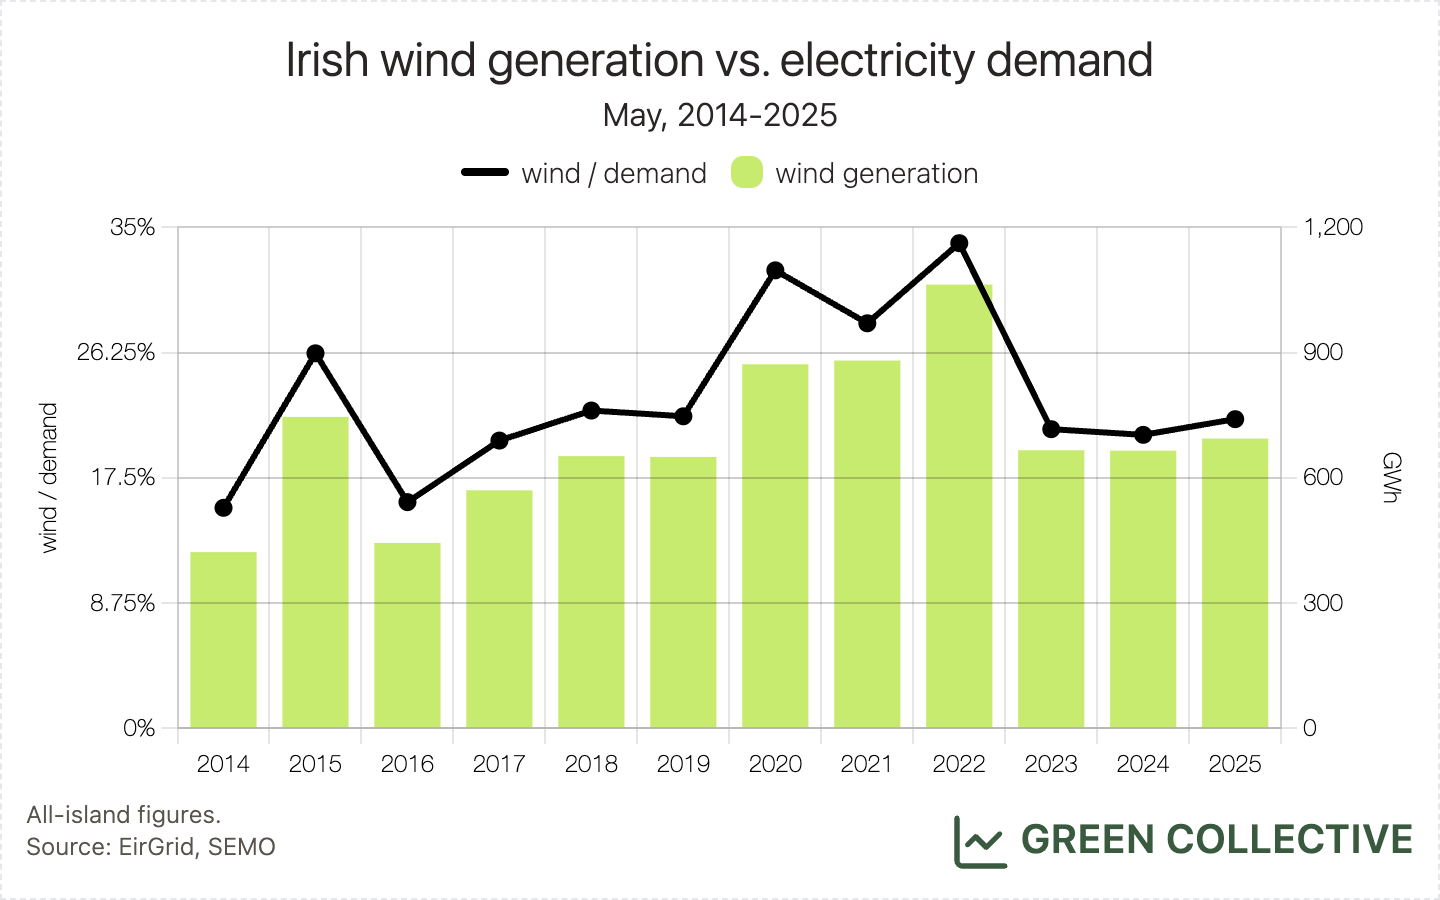
The island produced 694.4GWh from wind during May, equal to 21.6% of demand. Year-on-year, this was a little higher than May 2023 and May 2024 (666.3GWh and 665.4GWh, respectively). However, it was well below the 900GWh-1.1TWh we saw during May months between 2020 and 2022 and, in general, we can identify only a modest trend upwards for May wind generation since 2014.
With summer settling in, we were always likely to see longer periods of low winds and this certainly came true in May which experienced an exceptionally long period of strong sunshine. For the first three weeks of the month, wind generation equalled just 13.2% of demand; almost half of the month's wind generation occurred in the final 7 days.
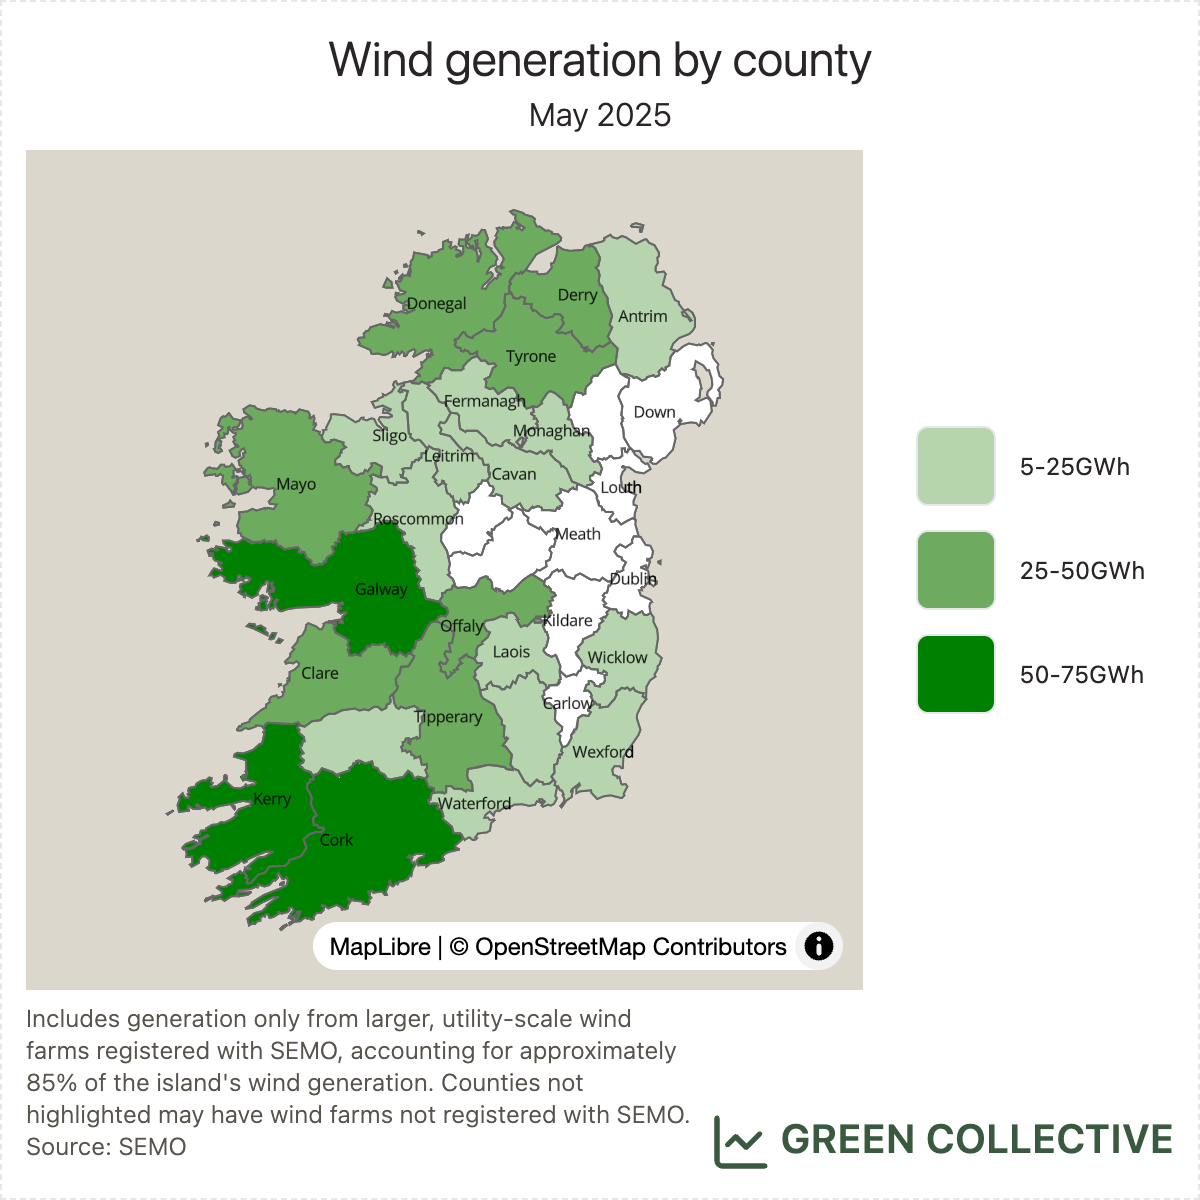
The top wind-producing counties during May 2025:
- Kerry (80GWh)
- Cork (63GWh)
- Galway (53GWh)
- Offaly (45GWh)
- Tipperary (43GWh)
As usual, Kerry takes #1 position for wind and Cork #2. This month, Galway occupies #3 position thanks to production at #5's (Mayo) Oweninny dropping significantly versus Galway Wind Park during May; in between those two stalwarts, Offaly re-enters the top 5 after being pipped by Tyrone in April thanks to its Yellow River wind farm back operating at full tilt.
Solar
May 2025 was the best month yet for large, utility-scale solar farm generation on the Irish grid:
- Generation from solar farms totalled 182.4GWh, equalling 5.7% of the island's electricity demand. Both figures smashed April's numbers of 135.6GWh/4.1% which were themselves new all-time monthly highs.
- Solar farm output peaked at just over 20% of the island's electricity demand for the first time on the weekend of May 17-18.
- Solar farms met 8.4% of electricity demand on May 18, a new daily record.
- Output from solar farms reached a new all-time high of 856MW on May 21.
- Solar farms generation exceeded 8GWh in a single day for the first time on May 21.
This is the first month since June 2024 that all significant solar records have been broken in a single month.
At this point, a little interlude for anyone who's been following EirGrid's website and social media channels closely and is wondering why some of the above figures differ from EirGrid's:
- At the time of writing, EirGrid's dashboard shows an all-time high for solar of 860.56MW at 12.43pm on May 17. This is probably correct. However, the timestamp (43 minutes past the hour) tells us that this figure is based on data at a 1-minute resolution rather than data based on a 15-minute resolution (timestamped at 0, 15, 30, and 45 minutes past the hour). EirGrid makes 15-minute data publicly available, making the 1-minute record, without any wider context, meaningless; in other words, we can only compare like with like.
- EirGrid boasts in this LinkedIn post of a new peak for grid-scale solar based on 1-minute data (covering the Republic of Ireland only): 752MW. We were travelling at that time and only saw the post later. As a result, we cannot say confidently on which day this record occurred, except that it was about two weeks ago. Pro-tip for EirGrid's comms team: include a timestamp.
While May was a month full of solar records, we would also like to draw your attention to dispatch down of solar. Last month, we described how downward dispatch at large solar farms like Gallanstown and Gillinstown had prevented certain new records. During May, we saw that Gallanstown and Gillinstown are essentially the only solar farms that received dispatch down instructions due to local transmission constraints. The charts below show a breakdown of constraints vs. curtailment for the last ten days of May at unit-level. This confirms these units are located within a particularly congested part of the transmission network, which is not surprising considering their location in Meath.
At the same time, we haven't yet seen these units achieve their maximum export capacity in 2025. It's particularly egregious at Gallanstown: the unit's output almost always remained under 80MW (about 40MW below its maximum export capacity) this year despite sunny periods. For reference, this solar farm saw consistent maximum output in 2024. We are a bit puzzled about what's going on here, so if you have any information on why these solar farms' output seems to be capped below their potential almost all the time, please send us a message!


Last but not least: last month, we highlighted an unprecedented five-day period during which solar beat wind to become the #2 source on the grid (not including imports). We're happy to see this occurred again during May, extending, in fact, to a six day period during which solar generation exceeded wind. From Monday May 5 through Saturday May 10, wind generation totalled 34.5GWh (5.5% of demand) and solar totalled 40.8GWh/6.5%.
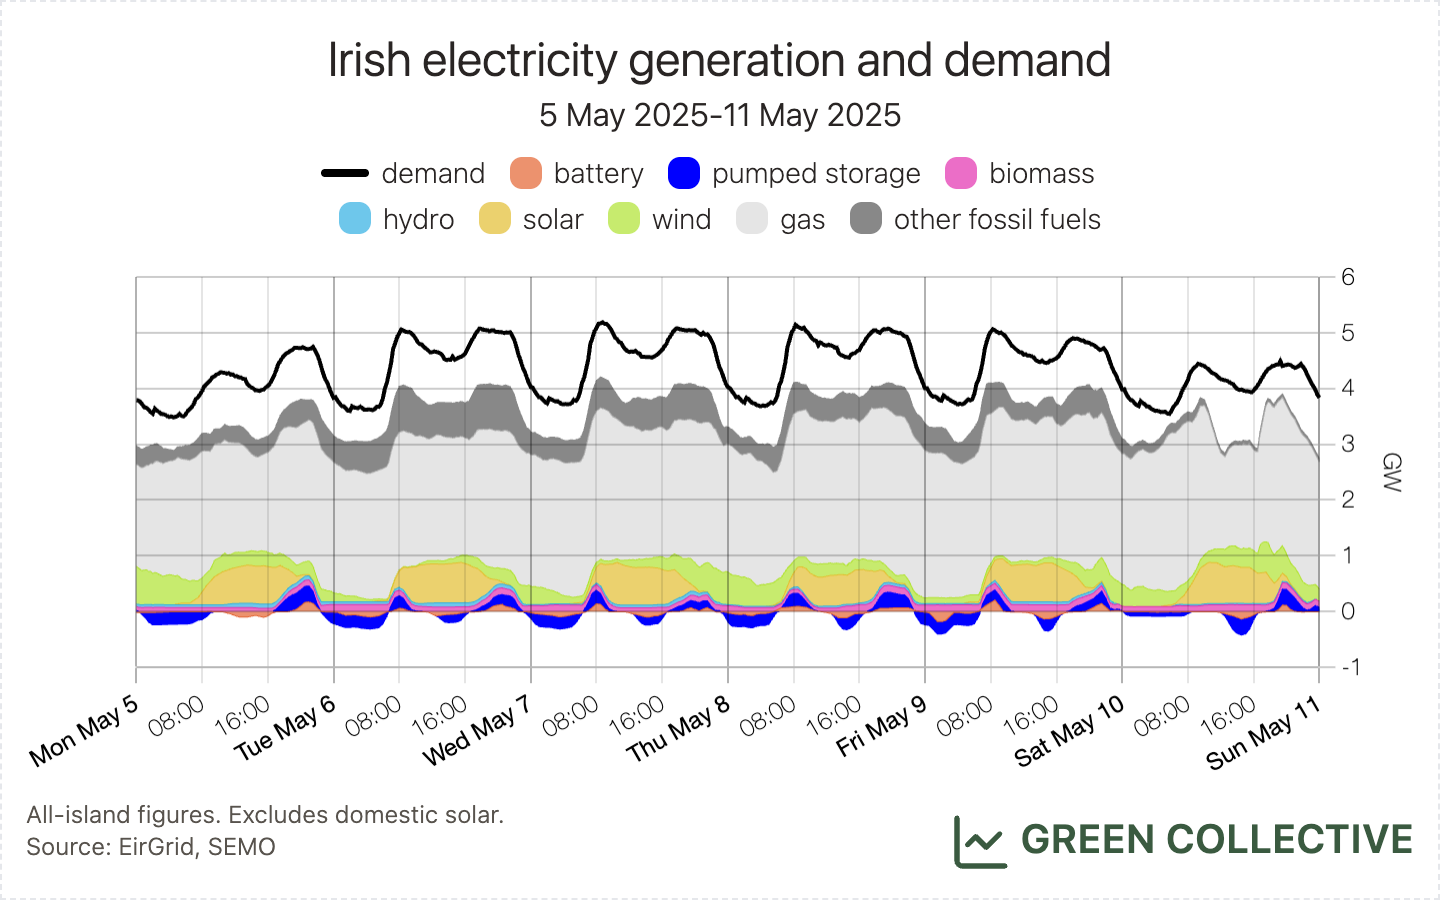
Also in a repeat of April, we're happy to report that year-on-year demand dropped slightly from 3241GWh in May 2024 to 3220.5GWh in May 2025 due to what we believe is the result of domestic solar helping to reduce demand on the grid (the so-called "duck curve").
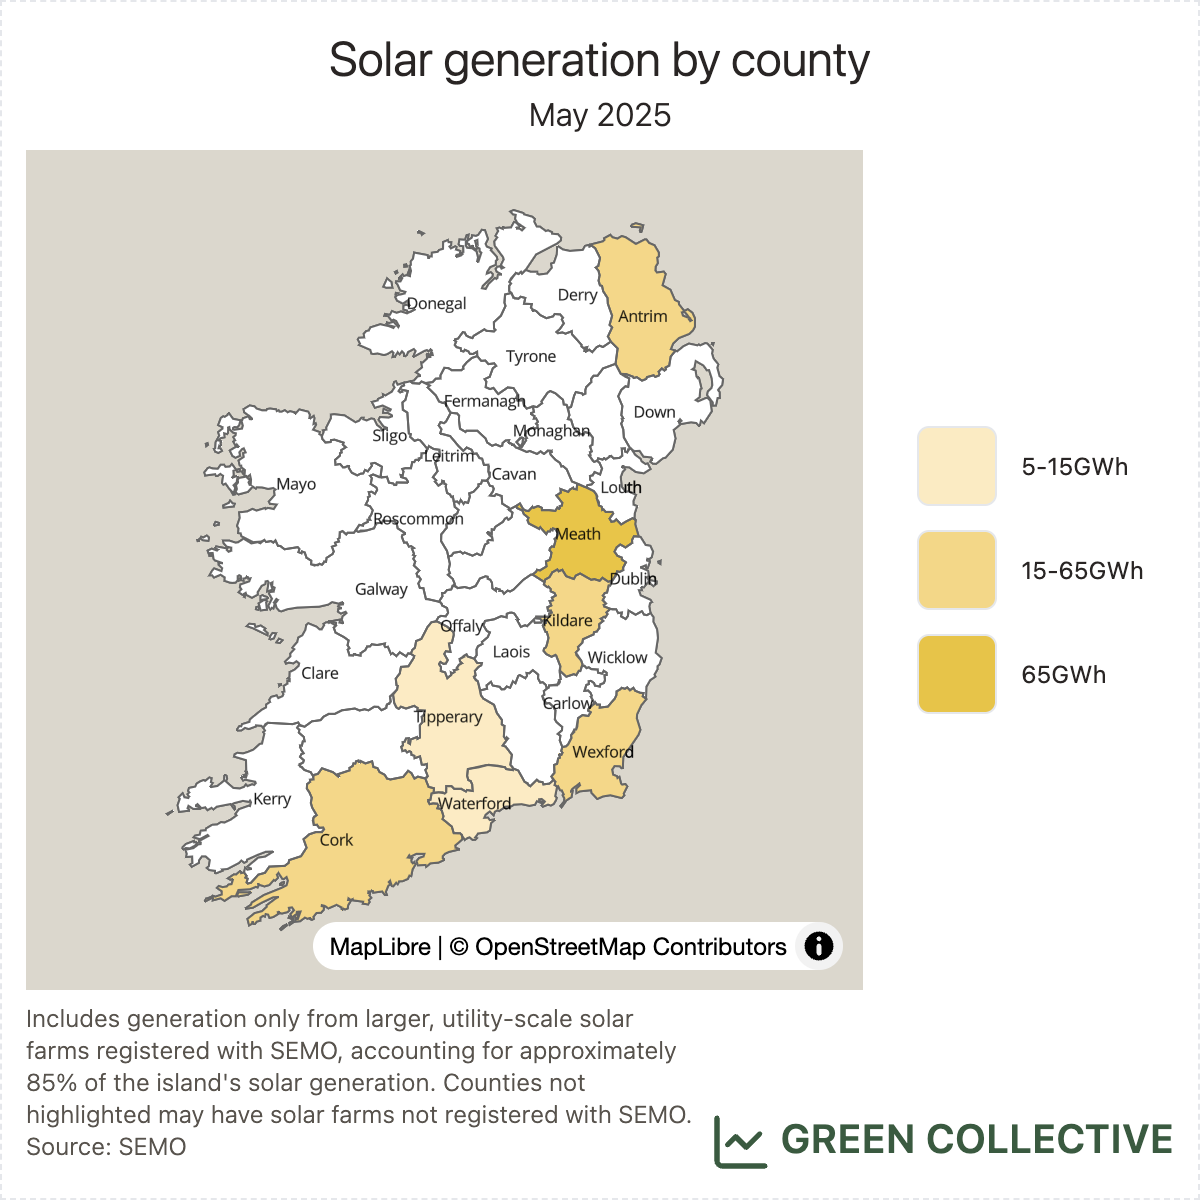
The top solar-producing counties during May 2025:
- Meath (68GWh)
- Wexford (32GWh)
- Cork (21GWh)
The county rankings are unchanged from last month: Meath, home to over 37% of production, remains the clear leader in Irish solar while Wexford - though home to the second-highest producing farm at Rosspile - produces less than half at approximately 17%. Cork finishes in #3 thanks mostly to Lysaghtstown, the third-highest producing solar farm this month.
Storage
Batteries discharged 7.7GWh during May, equal to 0.24% of demand. Both figures are new monthly highs for the Irish grid, ahead of the previous record holder of January's 6.7GWh/0.2%.
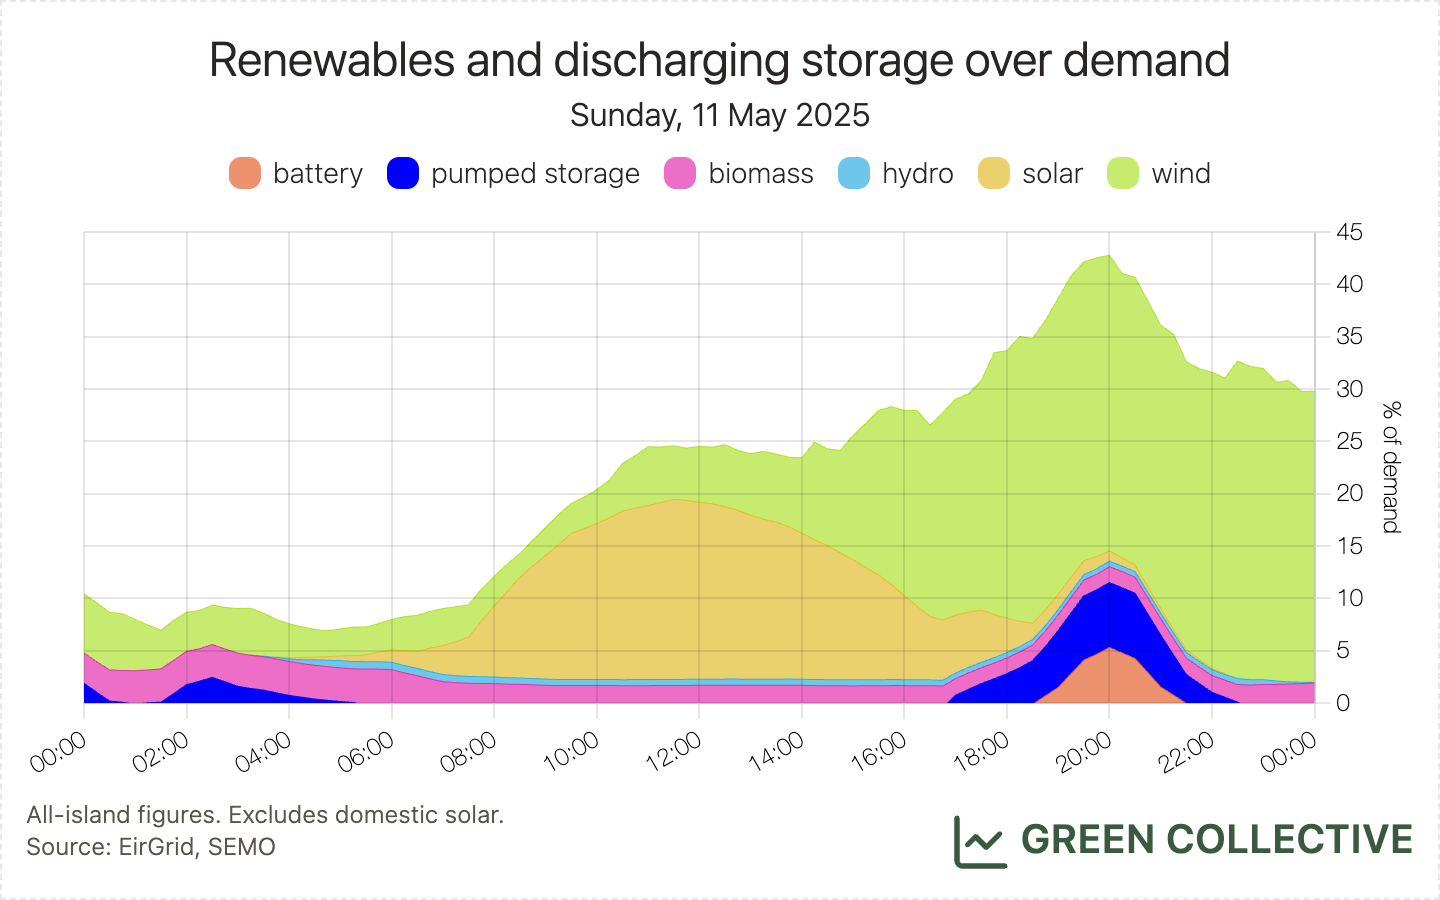
Although there were no new discharge highs, discharge has continued to exceed 100MW most days and, with falling demand, we're now seeing new records being set in terms of the percentage of demand being met by batteries. This record was broken three times this month, peaking on the evening on Sunday May 11 when batteries at one point were fulfilling 5.3% of the island's demand. As a reminder, we track this - and several other - records in real-time on our website.
In last month's newsletter, we discussed in detail why total battery discharge has not been reaching anywhere near the level of installed capacity and why this might change soon. We very much hope the current June deadline is kept because although wind generation will be dropping even more, strong solar combined plentiful battery capacity is a powerful combination that has been making headlines in other markets lately, notably California.
CO₂ Emissions
Fossil fuel generation totalled 1628.2GWh, equal to 50.6% of electricity demand. Both figures are the lowest during any May month for which we have data (2019 onwards).
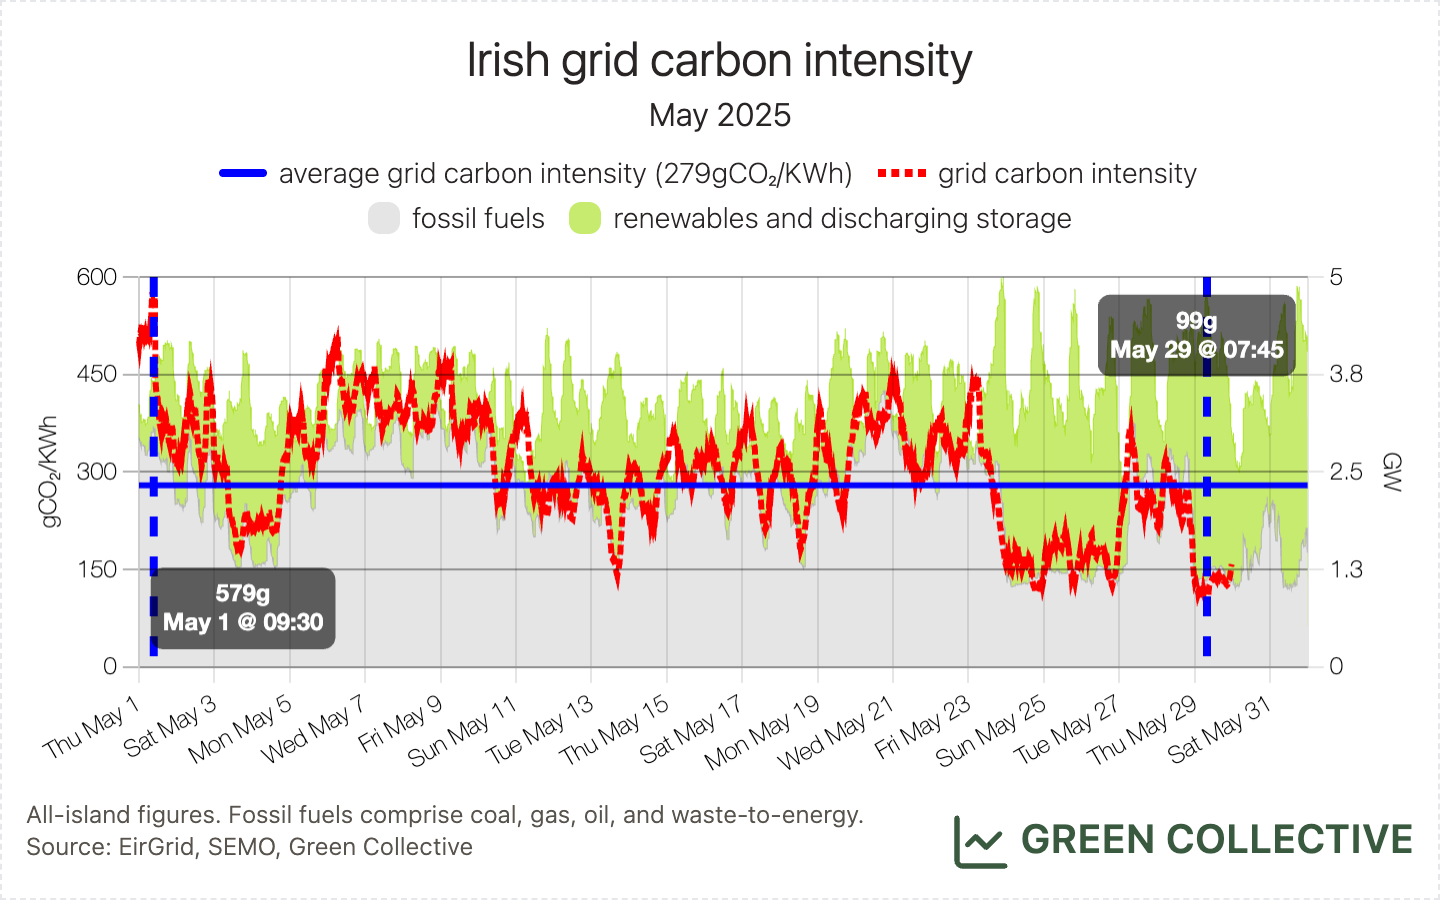
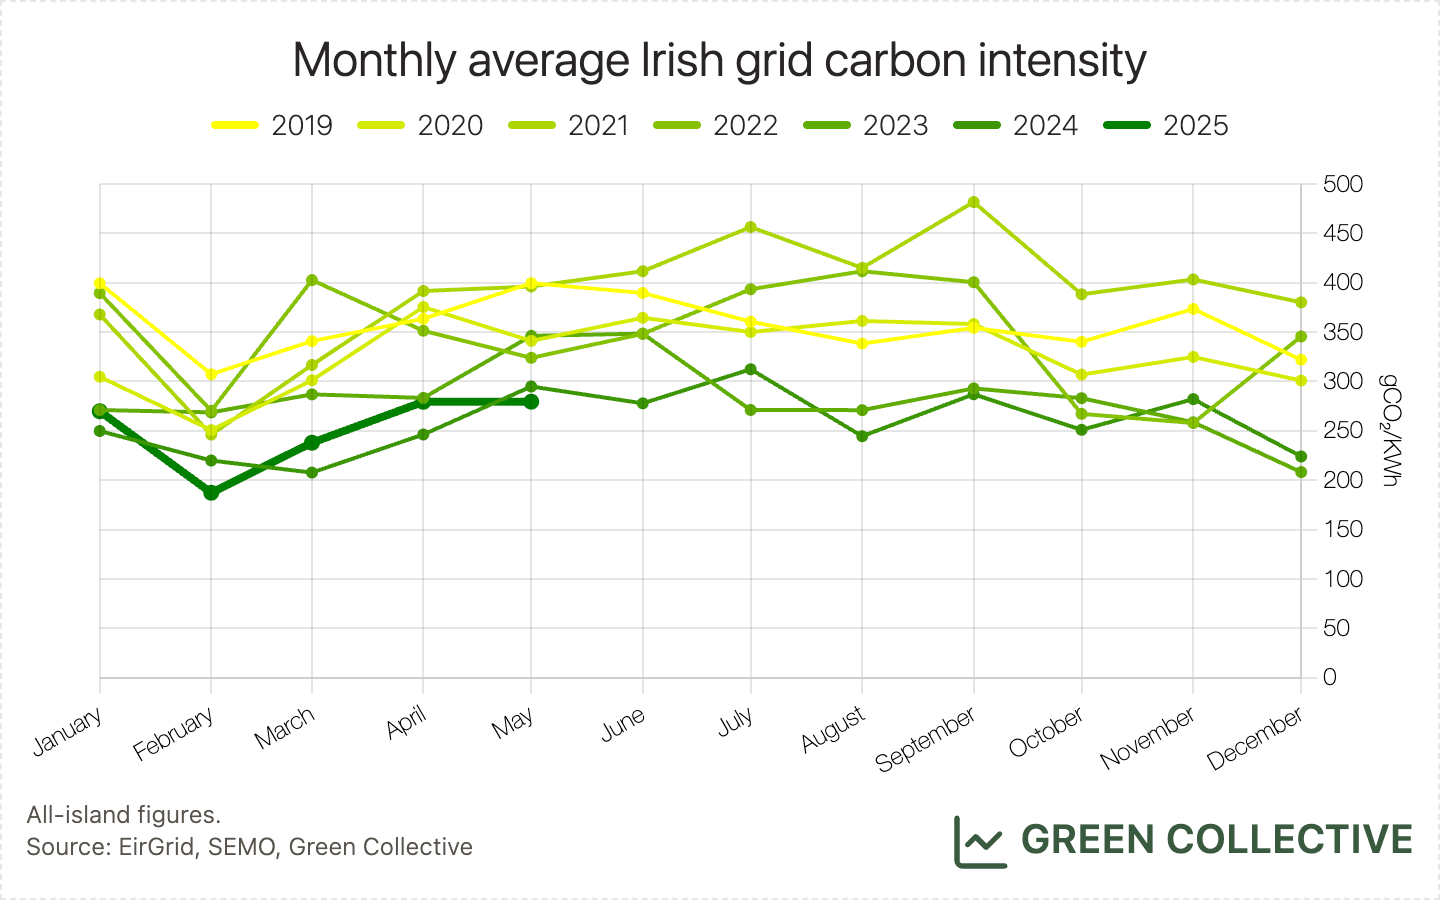
We estimate that for each kWh of electricity generated during May 2025 the Irish grid emitted between between 99g and 579g of CO₂, for an average of 279gCO₂/kWh. This was the lowest monthly average grid carbon intensity yet seen during a May month. Since 2019, grid carbon intensity during May months has fallen approximately 30%.
Gas, as usual, comprised the vast majority of fossil fuel generation. Waste-to-energy and oil were about normal while coal - though low by historical standards - was up significantly year-on-year to roughly 4x that of May 2024. Most coal generation occurred in the first week of May when multiple units at Moneypoint combined at times to reach 500MW. Coal generation in particular has a significant impact on grid carbon intensity and, indeed, the month's high of 579g occurred during this time; surprisingly/disappointingly, this is also the dirtiest figure we've seen on the Irish grid for over three years (April 2022).
To finish on a happier note: fossil fuel generation dipped below 1TW for the first time this year, and for the first time since November. This also occurred a number of times early last summer, perhaps suggesting a sweet spot at this time of year of lower demand mixed with still-high-at-times wind generation. Yes, Moneypoint's coal units were switched off at the time.
Imports/Exports
The island imported 639.5GWh, equal to 19.9% of demand. Both figures are new monthly highs on the Irish grid. We can attribute this to low renewable generation for much of the month. However, in terms of daily import highs, although several days during May now occupy one of the top 10 spots, we didn't see any new daily records. This suggests the interconnectors are not working quite as hard as they were earlier in the year.
While some folks have characterised Greenlink as increasing our reliance on Great Britain's grid, we disagree: so long as the GB grid remains, on average, cleaner than the Irish grid, this is better for everyone generally. For the future, well, interconnectors work in two directions. For more on the immediate impact Greenlink had on the island's carbon emissions when it launched earlier this year, see our February newsletter.
This does pose a question regarding interconnectors' impact on renewable dispatch down. Since interconnectors increase the system non-synchronous penetration (SNSP) along with inverter-based resources like wind and solar, more imports could lead to more system-wide curtailment of domestic wind and solar. Although looking at EirGrid's dispatch down data, the impact is unclear so far.
Since Greenlink started operating officially, from February to April 2025, SNSP issues accounted for 5.7% of all downward dispatch on solar in ROI, 2% on solar in NI, 5.2% on wind in ROI, and 1.8% on wind in NI. In other words, SNSP issues still only account for a small portion of dispatch down, but nominally speaking there has been more of an impact on solar. However, based on our analysis of SEMO dispatch instructions, as discussed earlier in the solar section, the key question regarding solar dispatch down for now might be why some large units's output seems to be persistently capped way below their maximum export capacity. Again, if you have any information you'd like to share, please send us an email at hello@greencollective.io. Many thanks in advance!
If you like what we do and want to support us, please share this newsletter with your network. Better yet, consider taking out a paid subscription, starting at 5 euro a month or 48 euro a year. Thank you!