Irish Grid Monthly: April 2026
Quick note from Trevor and Fei: Please excuse us if this edition of the newsletter is a little shorter than usual. During the month, we welcomed a long-awaited new addition to the family! Mam, baby, and Dad are all doing great.

Although we're dialling things back at work a little bit (don't worry, our newsletters will continue to hit your inbox), April was still an exciting month at the Green Collective:
- We're now officially supplying timely data for the Republic of Ireland to Ember Energy's API.
- We've improved our dispatch down classification. Below is a map showing wind generation and our estimates of dispatch down by county, covering January to April 2026. The blue parts of the pie charts show metered generation, while green and red represent curtailment and constraints respectively. These estimates line up with our understanding of regional differences: large wind producers like Kerry and Cork experience more system-level curtailment issues due to the sheer size of the fleet; wind generators in the midlands, the west, and especially Northern Ireland are more hampered by transmission capacity limits.
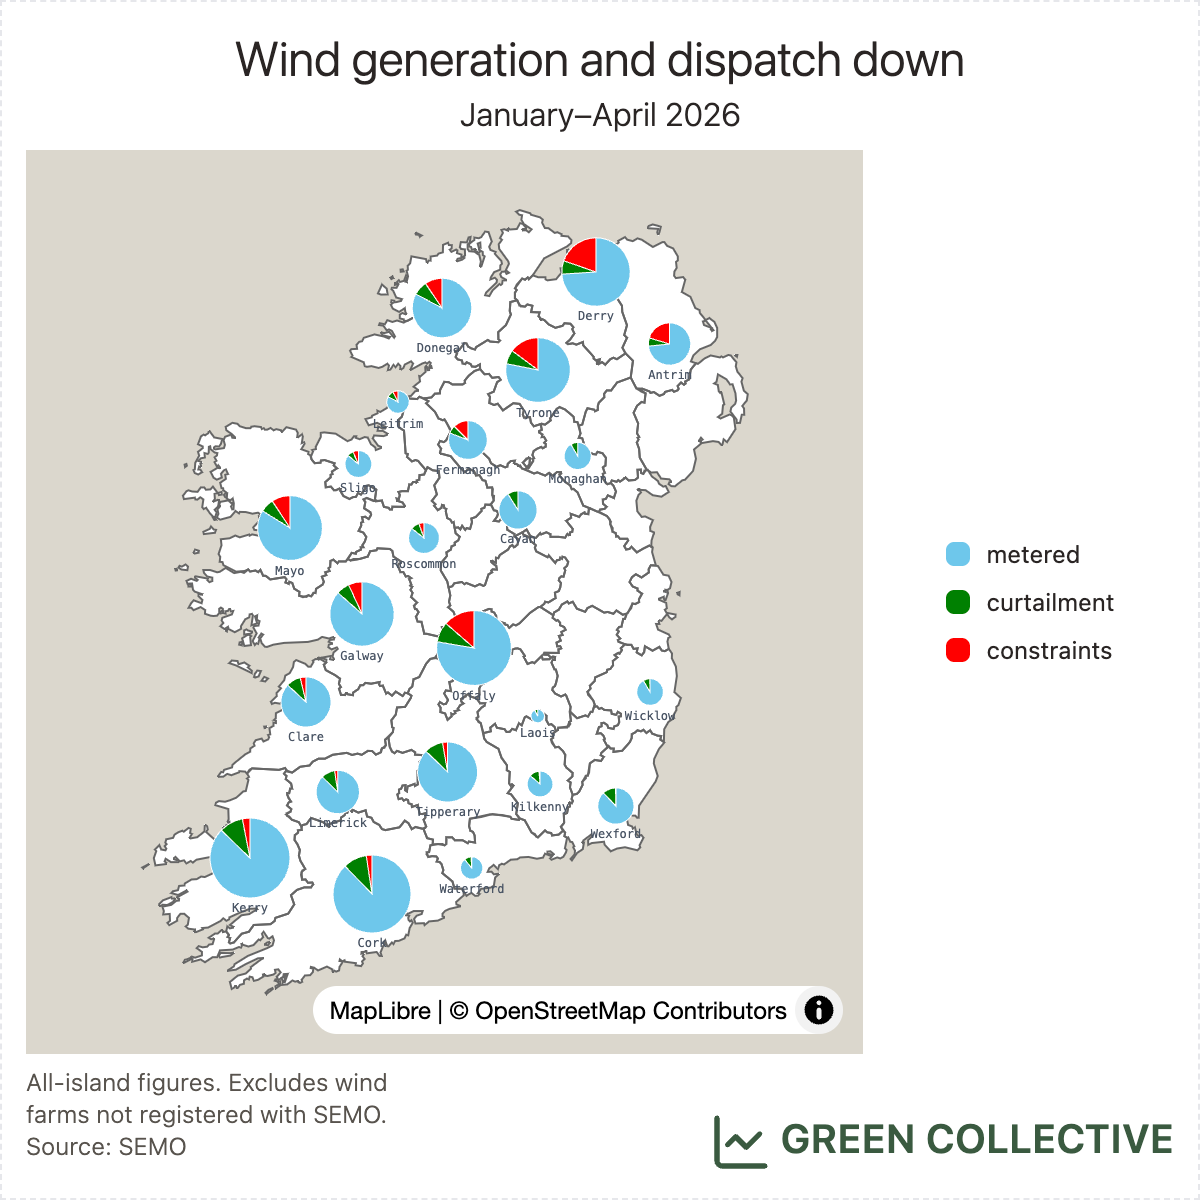
We detail our methodology and how our estimates (aggregated from unit-level data) compare with EirGrid's system-level data later in this issue.
Now, onto the key takeaways – April was another banner month for renewables on the Irish grid!
TL;DR
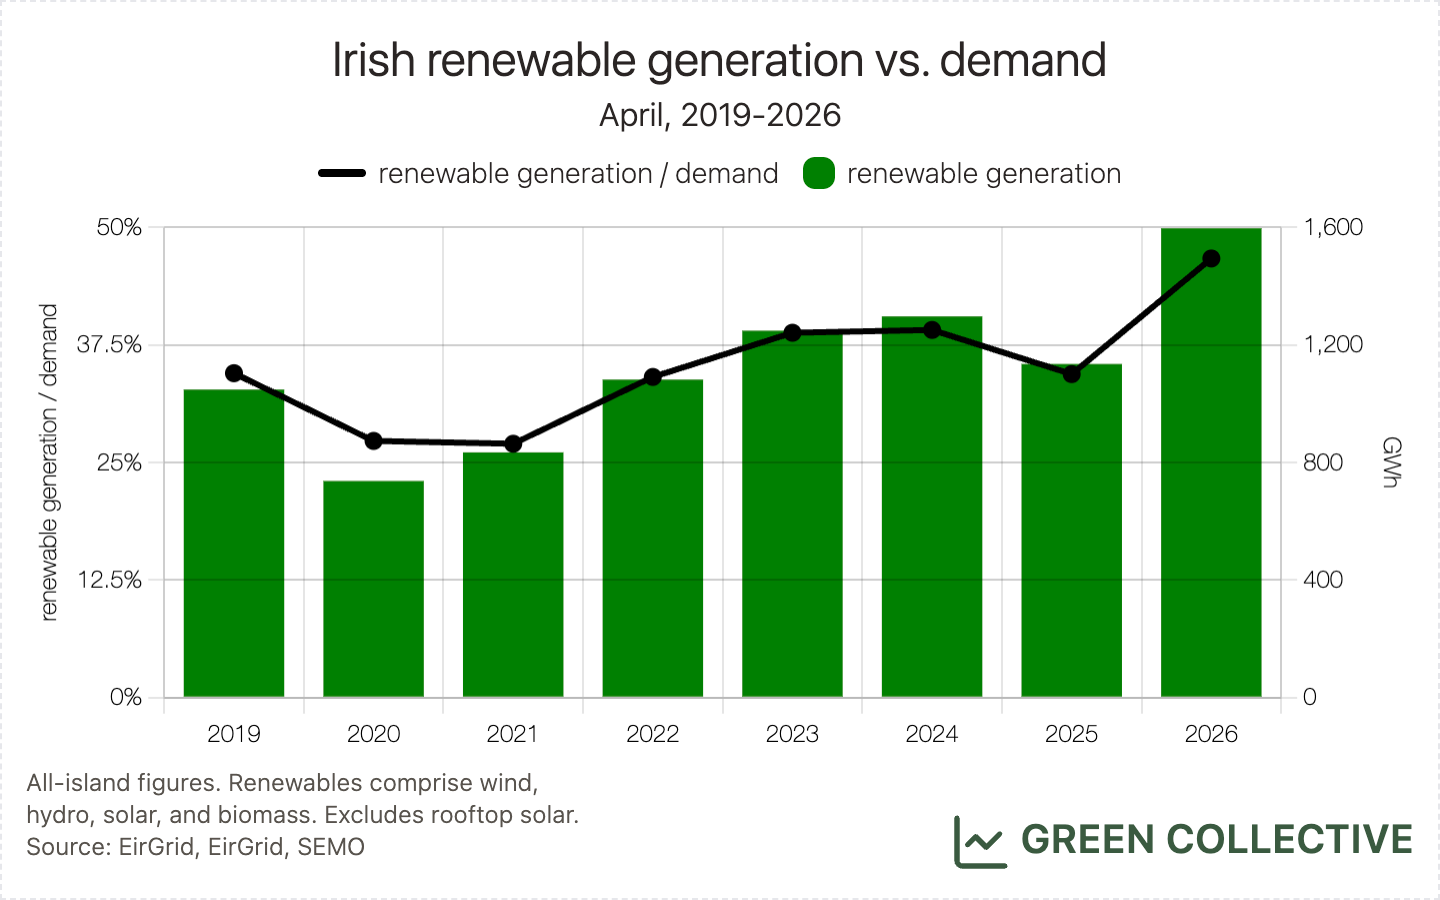
- April was a strong month for wind: Wind generation equalled 37.9% of all-island electricity demand, the highest percentage for any April month.
- April was also a strong month for solar: On the last weekend of the month, solar broke records days in a row, peaking at 1207MW on Saturday, April 25. With demand lower on weekends, the latter peak was almost 30% of the island's electricity demand at the time – a new high for the Irish grid. We are also seeing more prominent duck curves in Ireland: self-consumption of rooftop solar during sunny days last month decreased mid-day demand by more than 300MW compared to a day with similar conditions in April 2024.
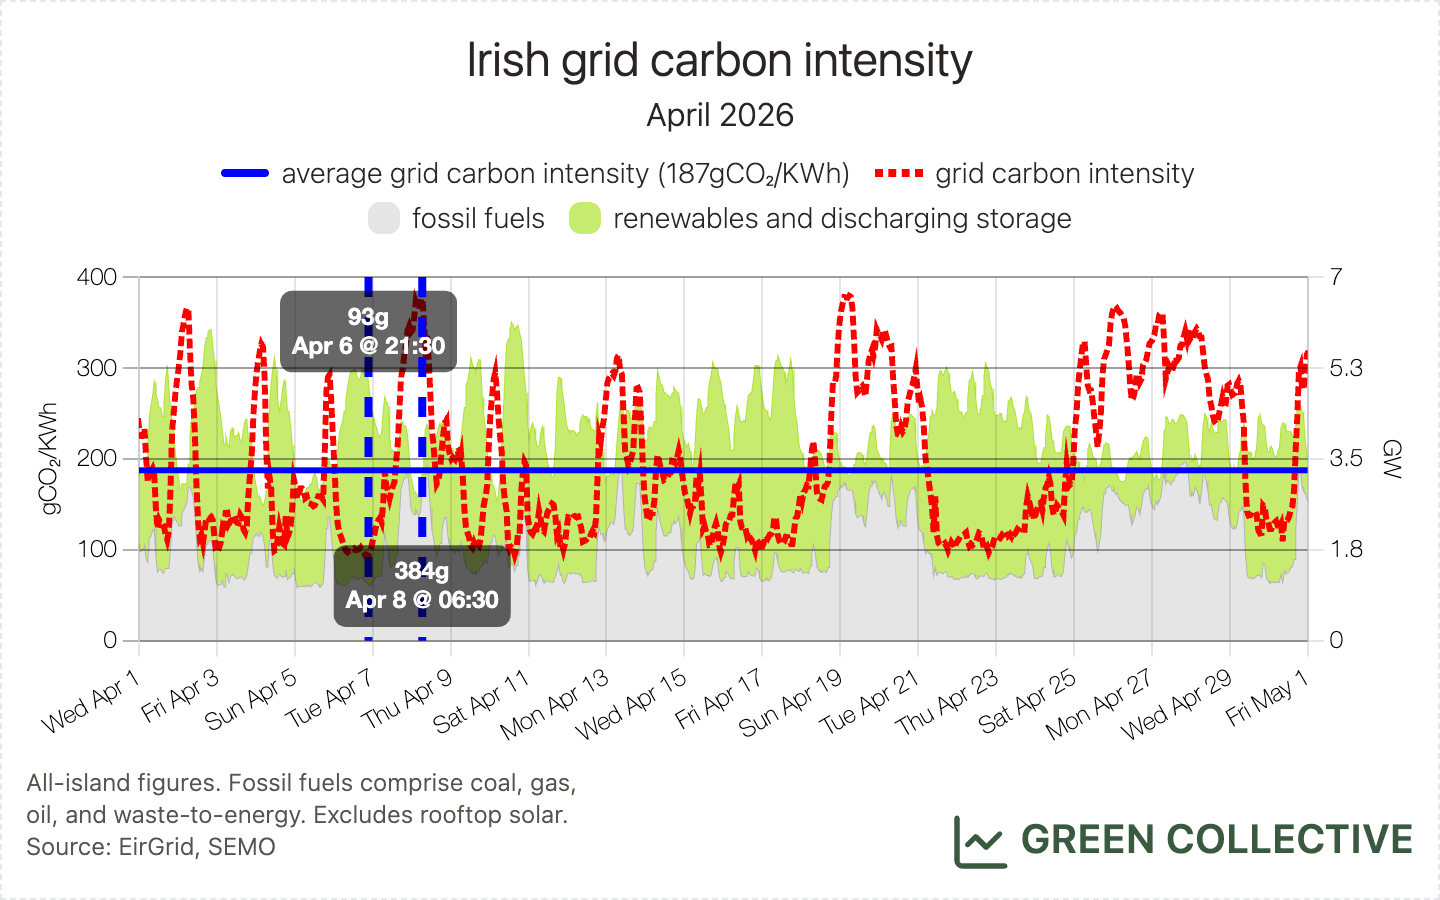
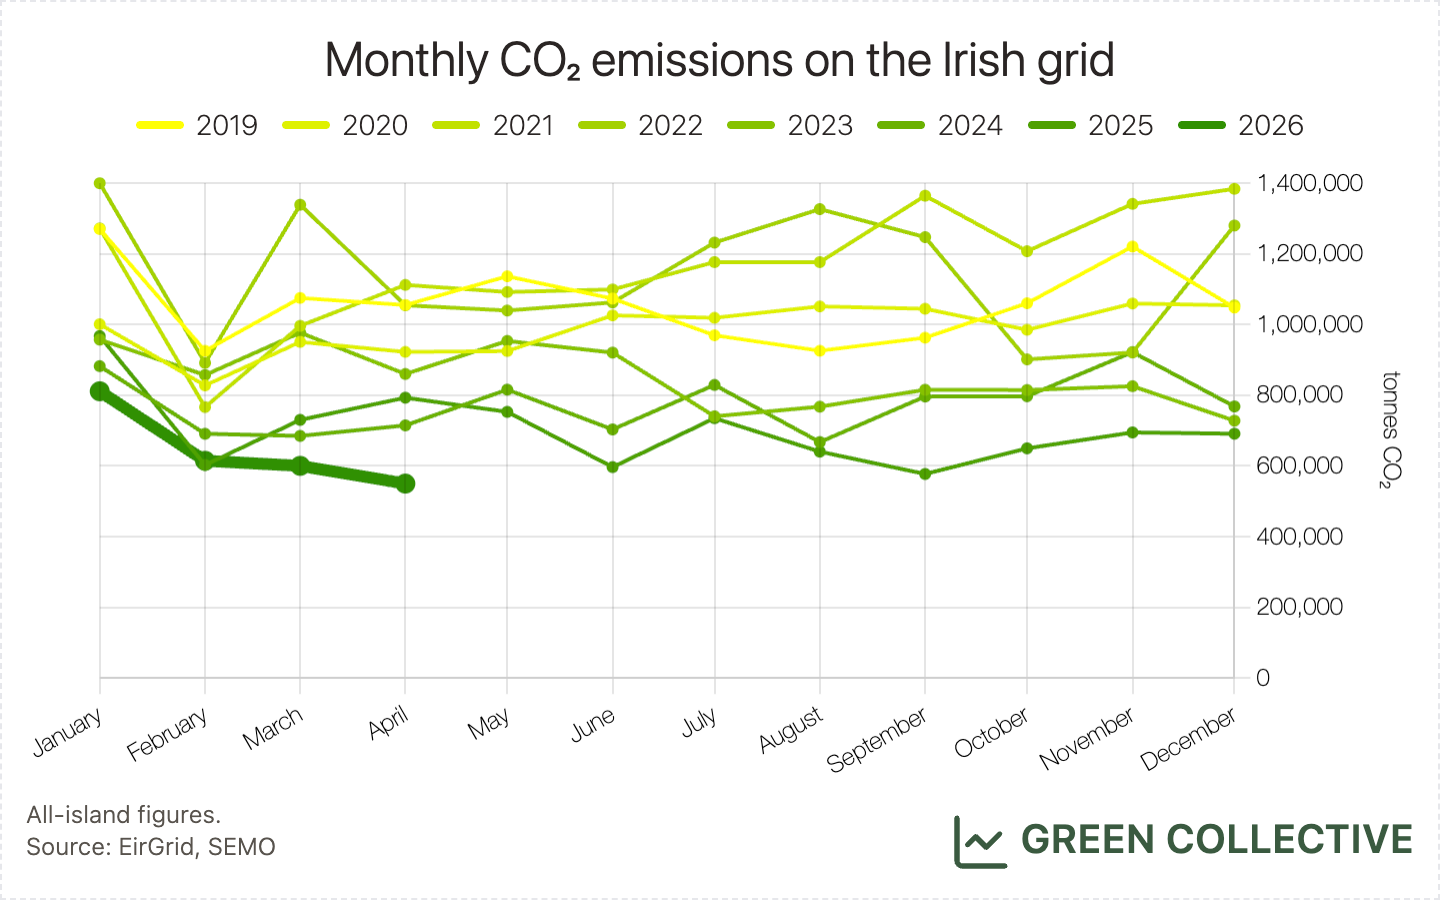
- April had the second-lowest monthly average grid carbon intensity, behind only March 2026's 185gCO₂/KWh, and the lowest ever amount of CO₂ emitted by the Irish grid in a single calendar month in modern times.
- Dispatch down and imports: Similar to March 2026, we estimate a wind dispatch down rate of around 20% in April 2026. Meanwhile, net imports equalled 14.1% of the island's electricity demand.
High-level stats
- Electricity demand on the island of Ireland totalled 3422.5GWh, a 3.5% year-on-year increase from April 2025. This was the highest demand ever seen during an April month.
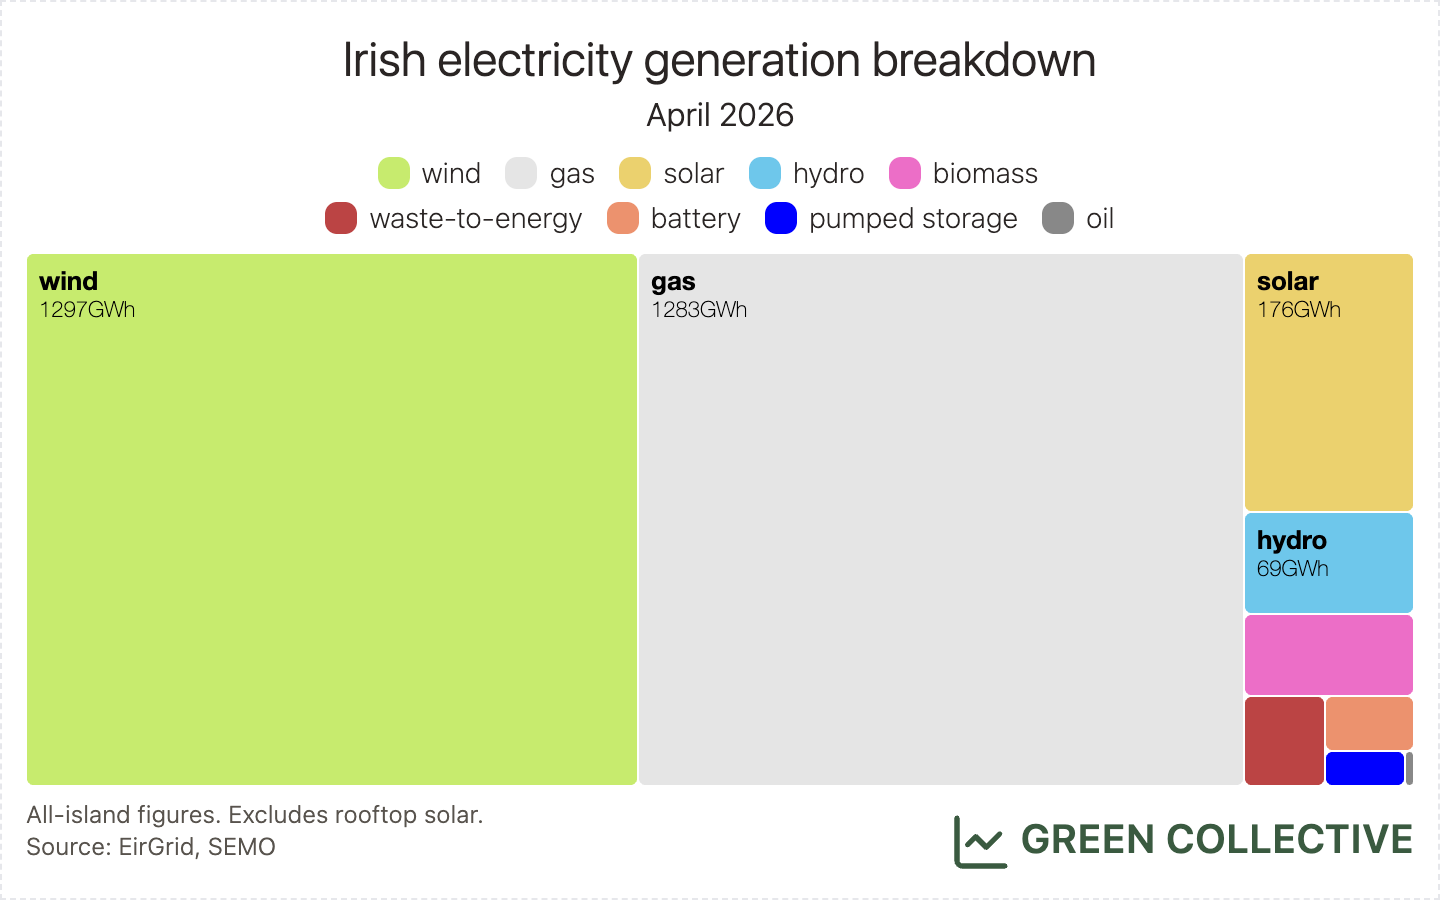
- Renewable generation totalled 1597.3GWh, equivalent to 46.7% of the island's electricity demand. This was both the highest ever total and share of demand for renewable generation in an April month, by some distance.
- Fossil fuel generation totalled 1313.4GWh, equivalent to 38.4% of the island's electricity demand. This was both the lowest ever total and share of demand for fossil fuel generation in an April month, again by some distance – April 2026's figure of 1313.4GWh is down fully 20% on April 2025's 1678.6GWh.
- Discharging storage totalled 30.6GWh, the most ever in an April month.
- Net imports totalled 484GWh, equivalent to 14.1% of the island's electricity demand. This was the highest total yet in an April month.
For the third month in a row, renewable generation exceeded that of fossil fuels. This is the first time we've been able to report such an occurrence and we believe it's unprecedented on the Irish grid in modern times.
Solar records and duck curves
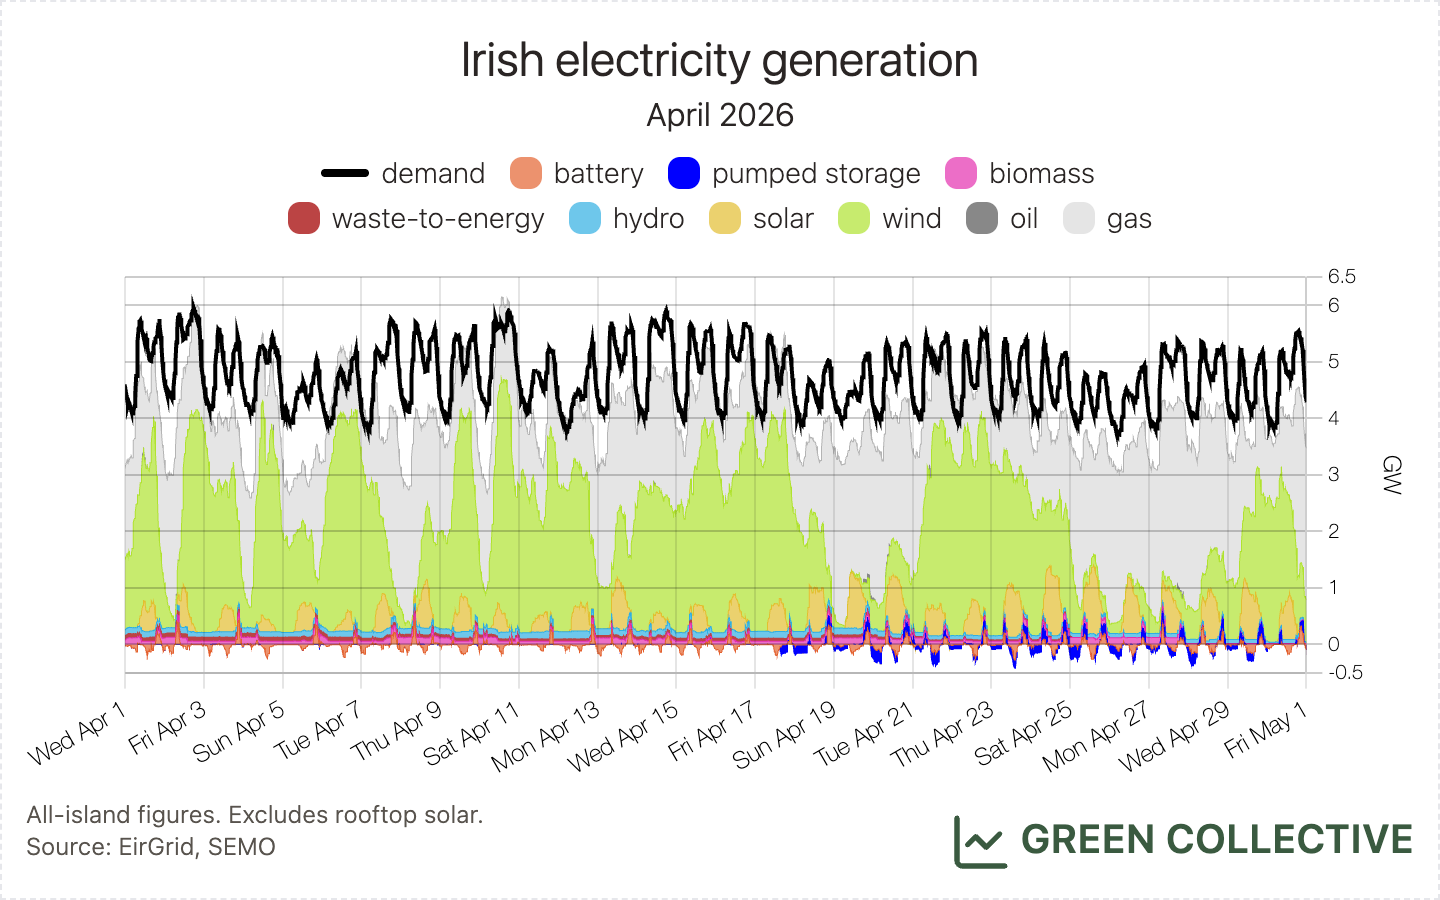
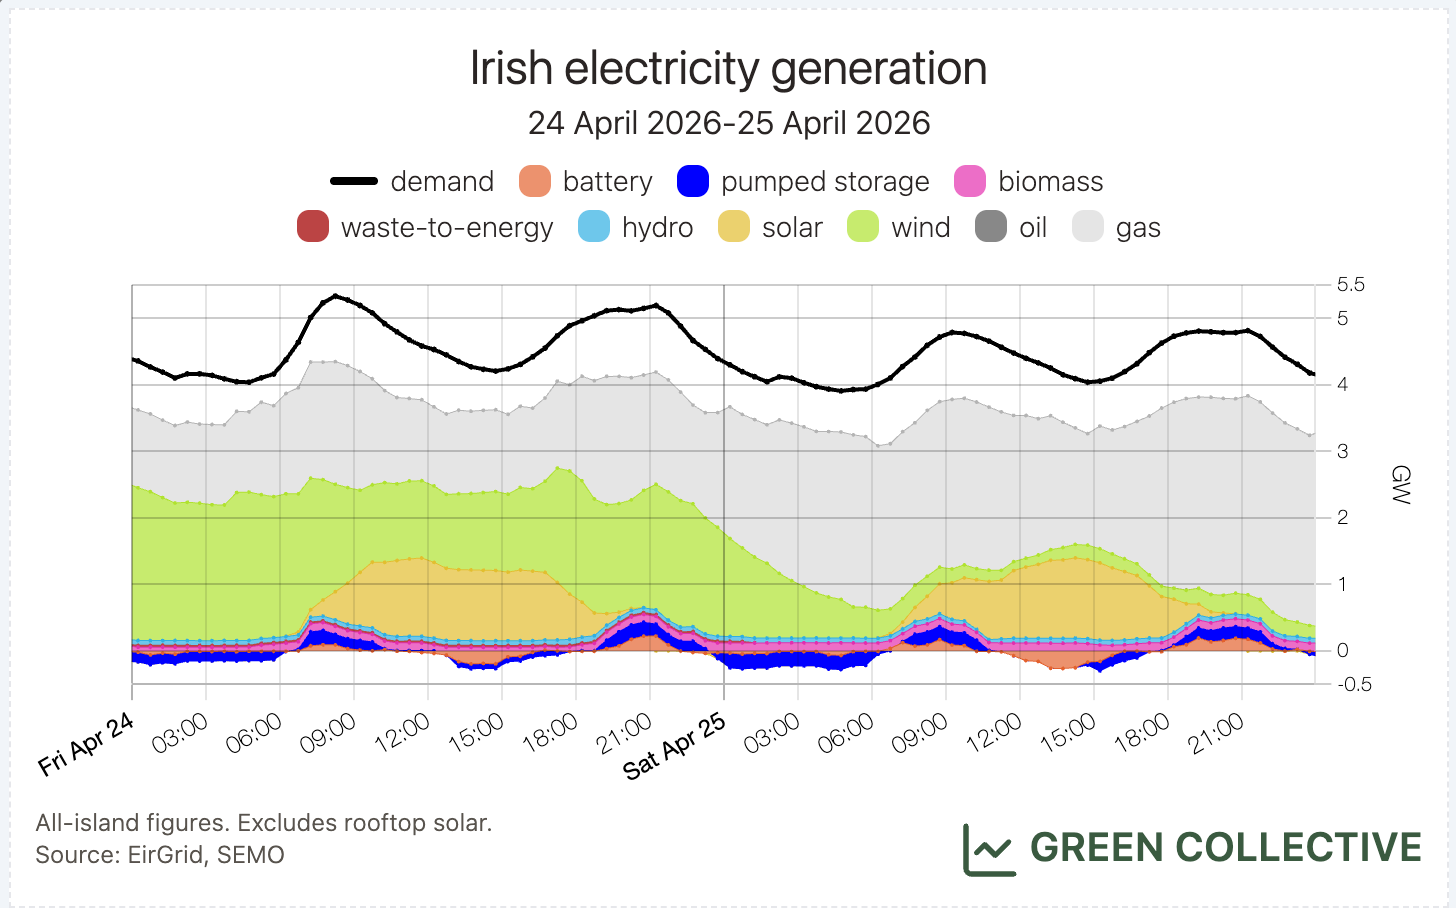
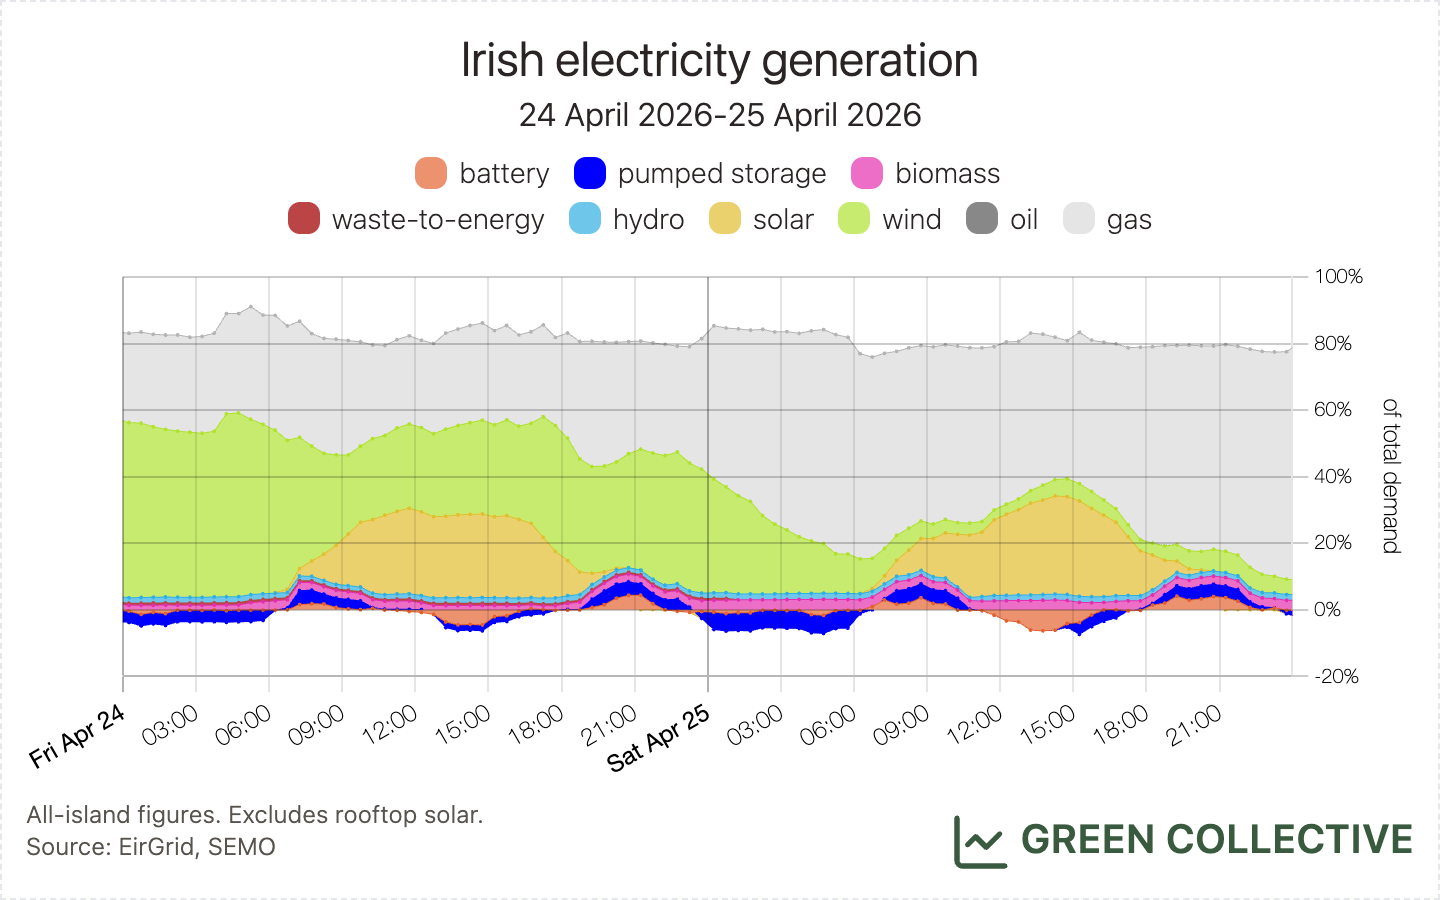
Following on from last month's extraordinary double record day of March 6, solar again reached new levels in April: on the last weekend of the month, solar broke records days in a row, peaking at 1207MW on Saturday, April 25. With demand lower on weekends, the latter peak was equivalent to almost 30% of the island's electricity demand at the time – a new high for the Irish grid.
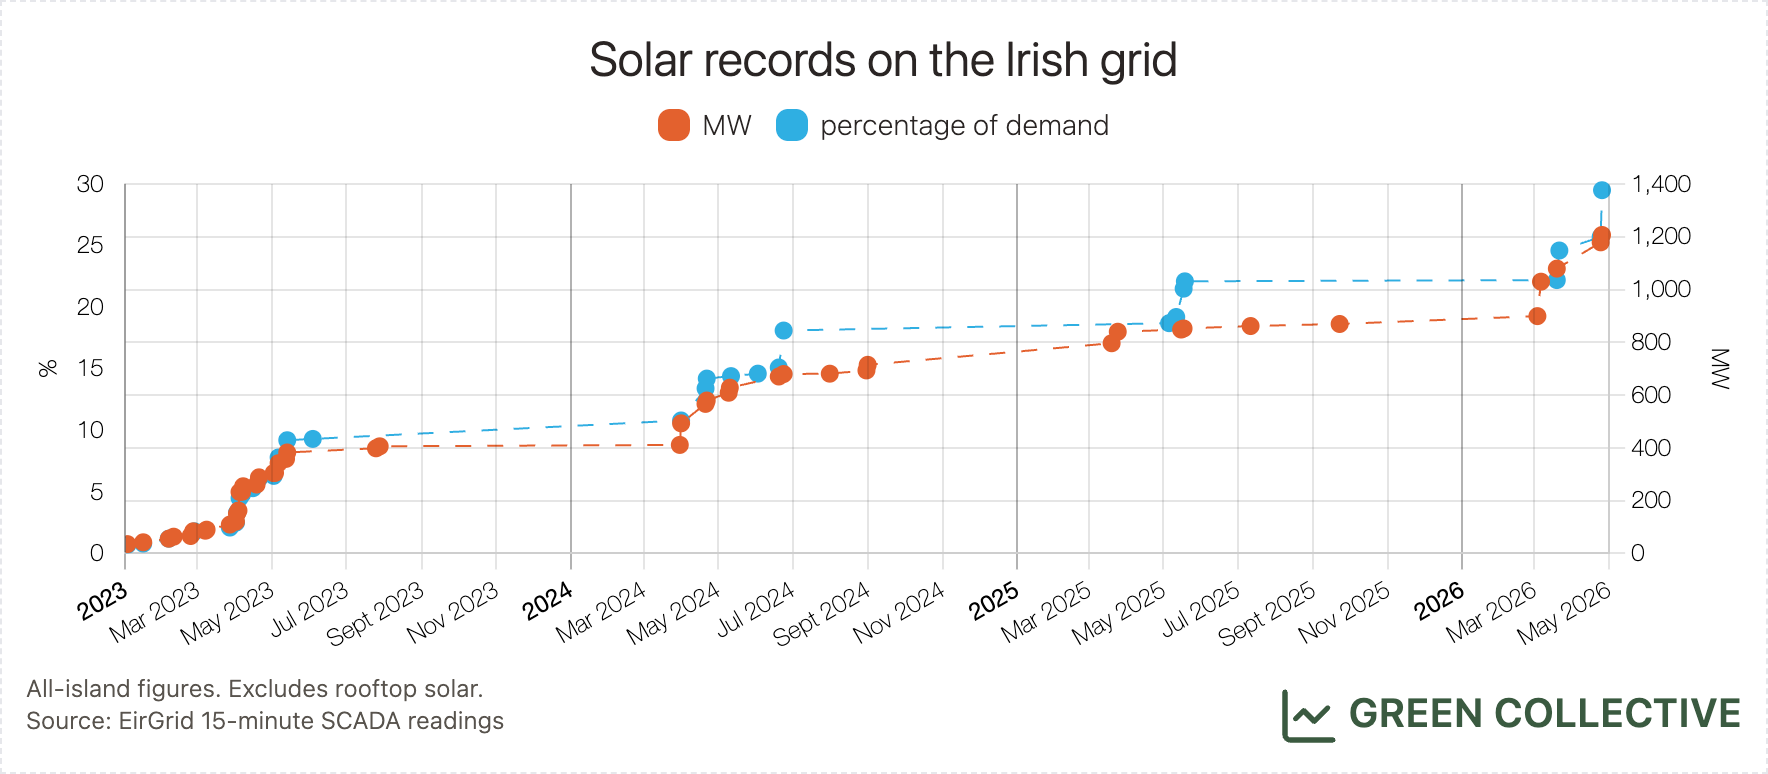
Additionally, solar records are once again coming in giant steps: late last year, we lamented in this newsletter how solar records were only inching upwards, at a pace far behind that of capacity. This has changed, with our records page once again showing leaps equal to what we were seeing back in 2024. Indeed, if our estimate of the island's solar farm capacity at 1.55GW is correct, peaks are approaching their theoretical maximum.
One of the most frequently asked questions we get is whether our charts include rooftop solar. No, they do not! Our charts cannot directly show how much rooftop solar feeds back into the grid because that data is simply not publicly available. However, the impact of the increasing number of microgeneration connections in Ireland is illustrated as a decrease in mid-day demand as a result of self-consumption of rooftop solar generation. This is known as the duck curve which we first wrote about back in the summer of 2024.
Back in April 2024, there were around 89,000 microgeneration connections in the ROI. As of the beginning of 2026, that number has nearly doubled to reach 169,000 connections, bringing microgeneration capacity from 346MW to 727MW (we are only including ROI data below, since rooftop solar data for Northern Ireland is not readily available).
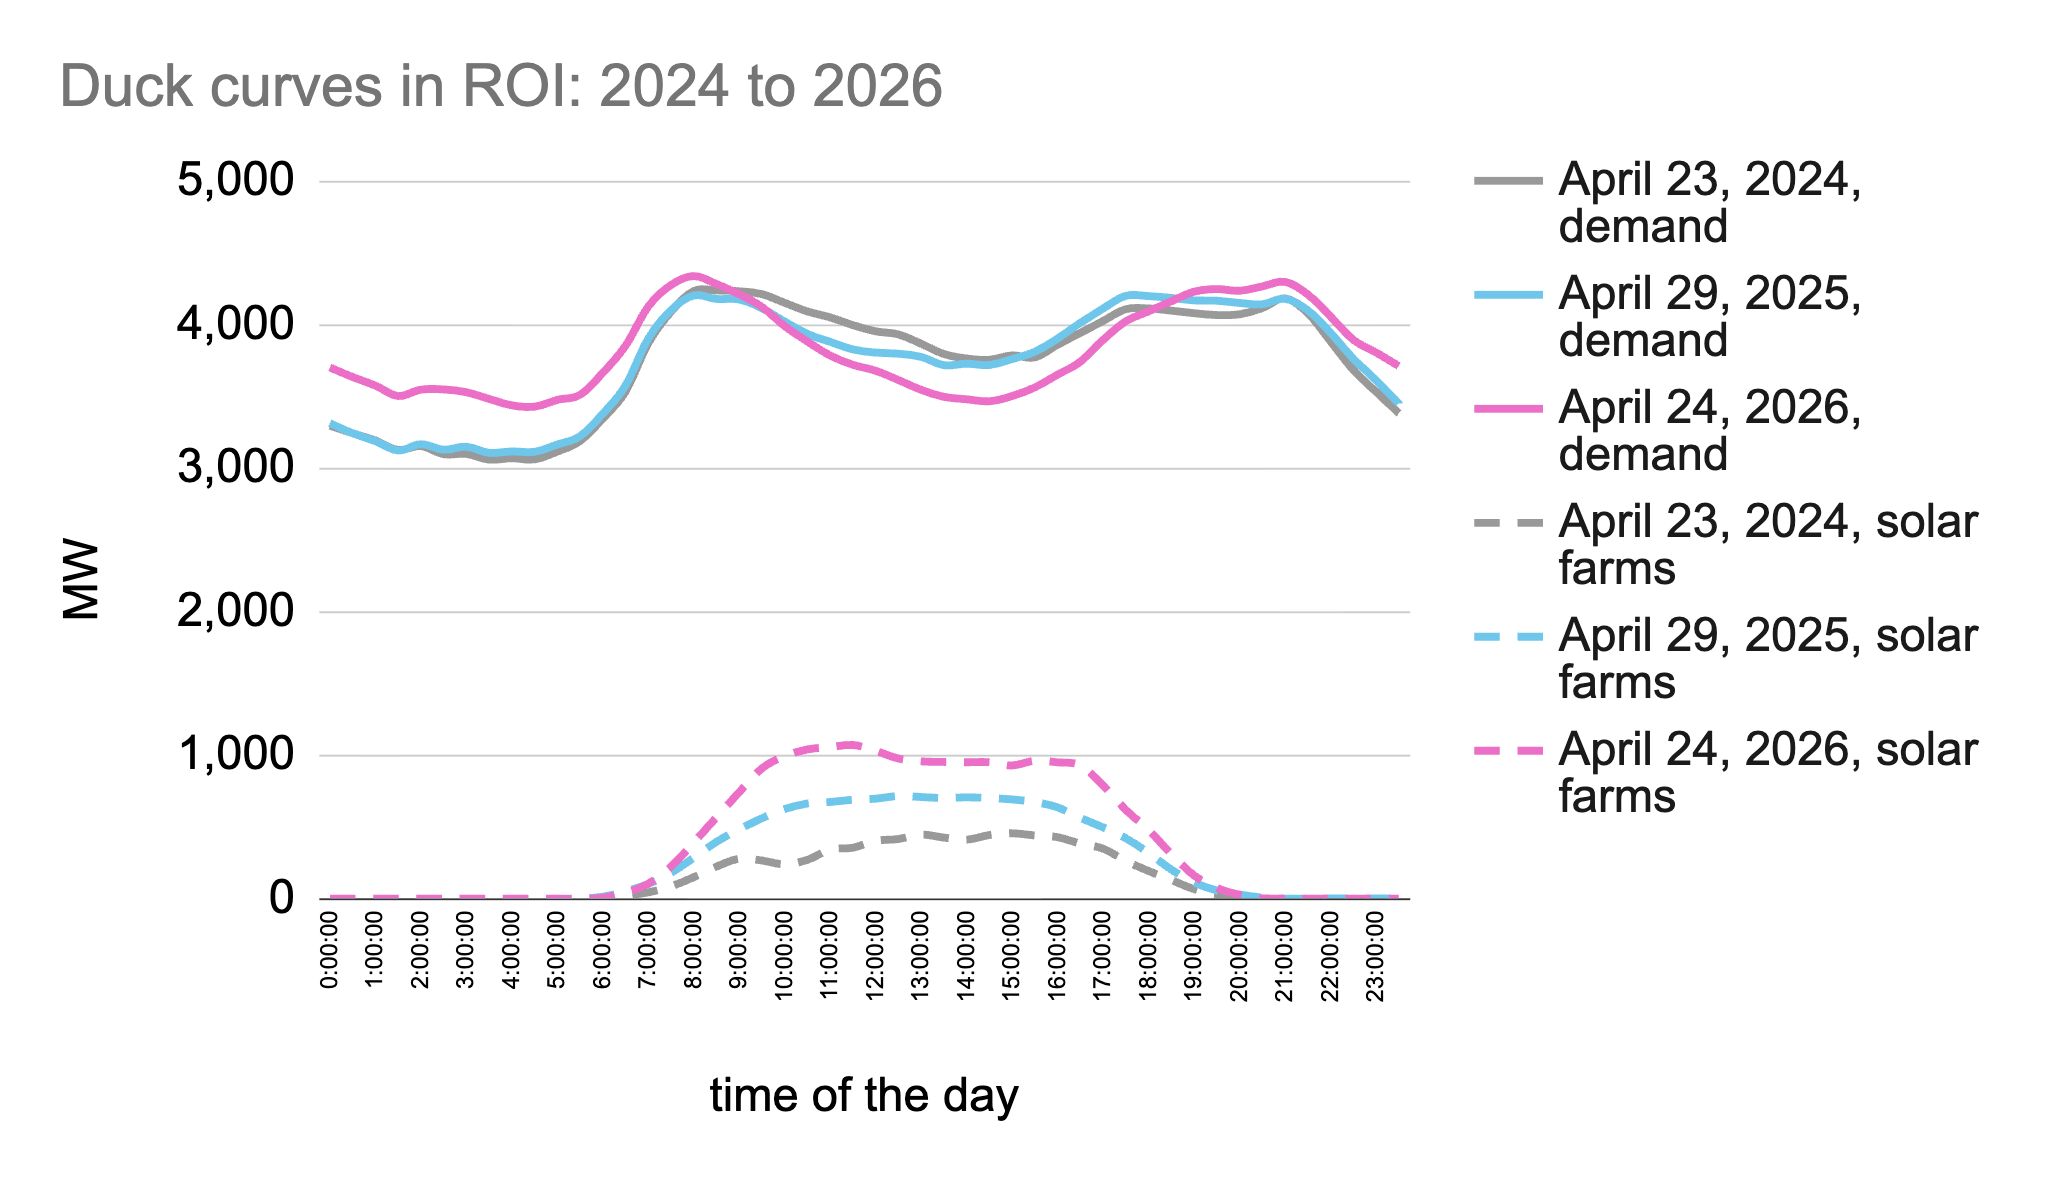
The chart above shows demand curves and generation from solar farms on the three April weekdays with the highest solar output in 2024, 2025, and 2026, respectively. On April 24, 2026, utility-scale solar output surpassed 1GW in the ROI, much higher than the peak outputs of 456MW in 2024 and 715MW in 2025. Demand-wise, outside of solar-producing hours, demand in 2026 was higher than 2024 and 2025, where the difference could be as large as 15%. However, self-consumption of rooftop solar during the day visibly decreased total demand from the grid. When comparing 2026 demand with 2024 and 2025, the biggest gap reached more than 320MW, showing a much more prominent duck curve than the one that first appeared in 2024.
We would love to see data on how much rooftop solar feeds back into the grid made publicly available, by either ESB Networks or suppliers. Before that becomes reality, we can only infer the impact of rooftop solar by comparing demand curves and showing the deepening of duck curves.
Carbon emissions
We estimate that during April 2026 the Irish grid emitted approximately 550,000 tonnes of CO₂, ranging, for each kWh of electricity generated, between 93g and 384g of CO₂ for an average grid carbon intensity of 187gCO₂/KWh. This is the second-lowest monthly average grid carbon intensity, behind only March 2026's 185gCO₂/KWh, and the lowest ever amount of CO₂ emitted by the Irish grid in a single calendar month in modern times.
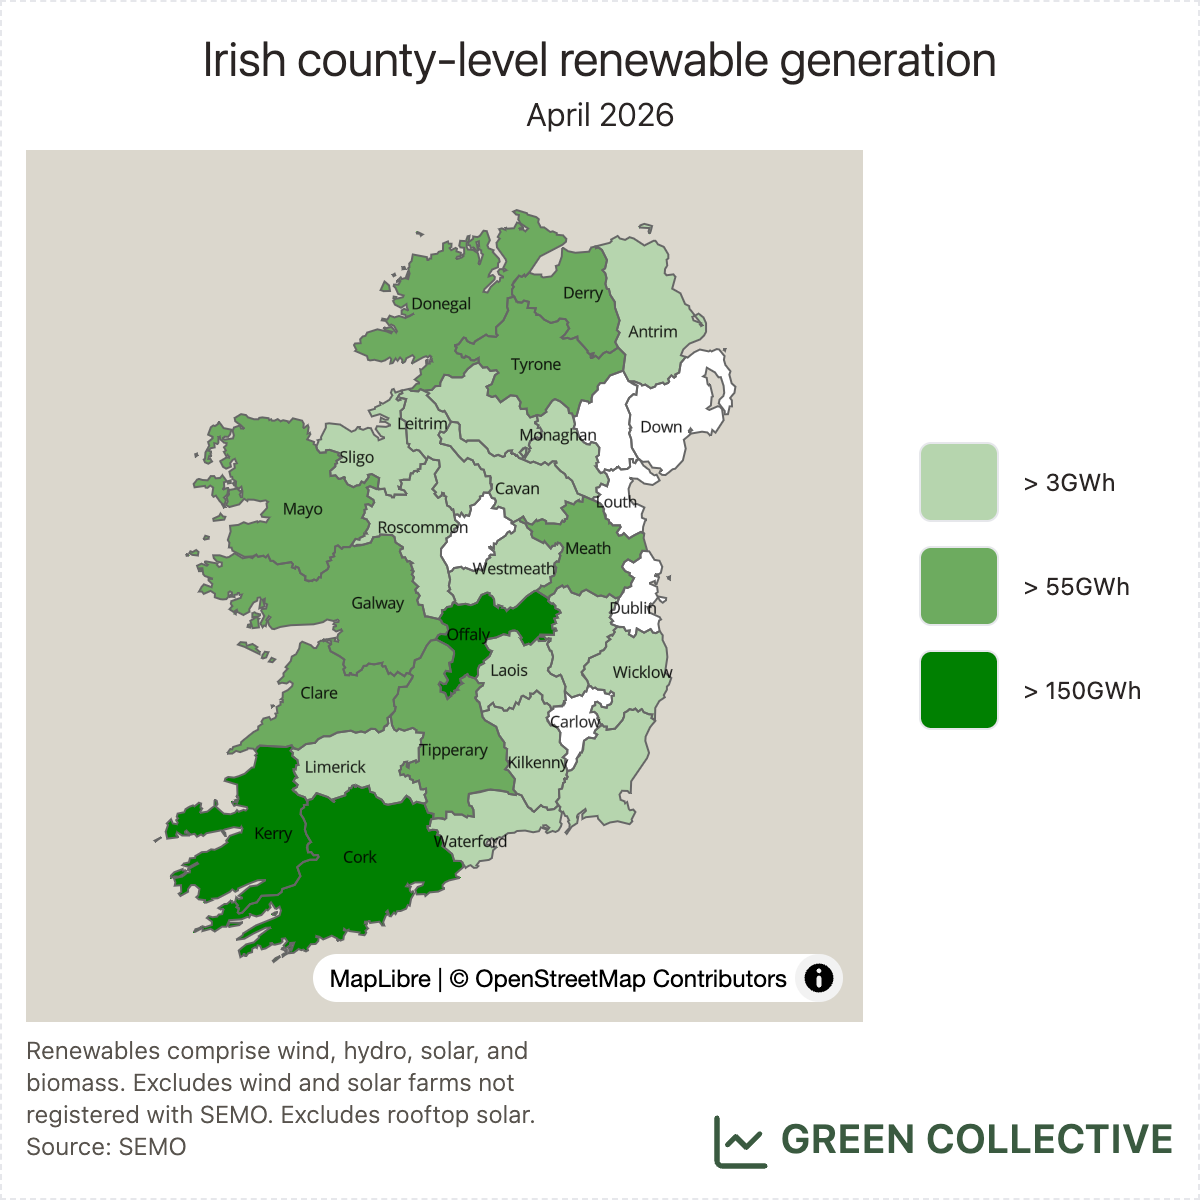
County-level analysis
The top five renewable-producing counties during April 2026:
- Cork
- Offaly
- Kerry
- Clare
- Galway
Offaly drops down to #2 this month, just beaten by Cork. Outside of the usual clear top trio of Cork, Kerry, and Offaly, Clare and Galway maintain their positions from last month. Clare is still hanging in there thanks to Ardnacrusha: despite production being well down this month vs. the winter months, it still produced more power this month than all but a handful of large wind farms.
Thank you for reading! The second half of the newsletter is available to paying subscribers. We go into more details on our dispatch down estimates and cover more highlights for wind, solar, storage, and fossil fuels respectively. You can upgrade your subscription to access all our analysis, starting at 5 euro a month.